Giuseppe Ditaranto
Investors in modern times hold portfolios which combine liquid assets, including stocks and bonds, with illiquid assets such as real estate, collectibles, and private equity. The focus of traditional wealth management applications on liquid holdings produces inaccurate risk perception and prevents proper portfolio diversification. The research examines how investors perceive risk when liquid and illiquid assets are combined and displayed through a unified wealth management app prototype while assessing the application's usability. The research adopted a user-centered design method based on the Double Diamond model to collect mixed-methods data from twelve participants through semi-structured interviews and a UX workshop with investors.

Traditional wealth management apps often focus only on liquid assets, potentially leading to inaccurate risk perception and hindering proper diversification. Diversification is crucial (Markowitz, 1952) but often underutilized by individual investors (Reinholtz et al, 2016).

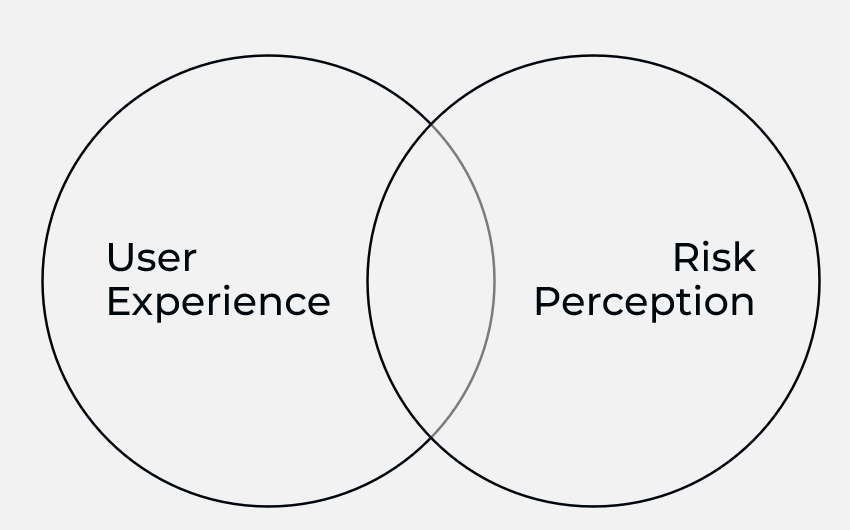
At the intersection between UX and Risk Perception
Jacobson's (2015) study explicitly investigates how usability influences risk perception. The results gather qualitative data associated with risk perception through pre-test and post-test interviews with participants who used an interactive tool to analyse sea level rise. The study also observed and recorded user emotion and response as potential indicators related to how risk information was perceived. The finding that negative emotional responses correlated to a negative perception of usability suggest an indirect link between UX (usability) and perceived risk. This concept is supported by both Norman's (2004) findings on the impact of product design on user emotion and Jokinen’s (2014) study on the relationship between user emotion and task performance.
Gamification in Investment App
As highlighted by Chaudhry and Kulkarni, design patterns in investing apps, particularly hedonic gamification elements like confetti and reward animations, can blur the lines between investing and gambling. This is a concern echoed by regulators (Chapkovski, 2023). Such features, while potentially increasing user engagement, may inadvertently reduce investors' perception of the inherent risks associated with financial products.

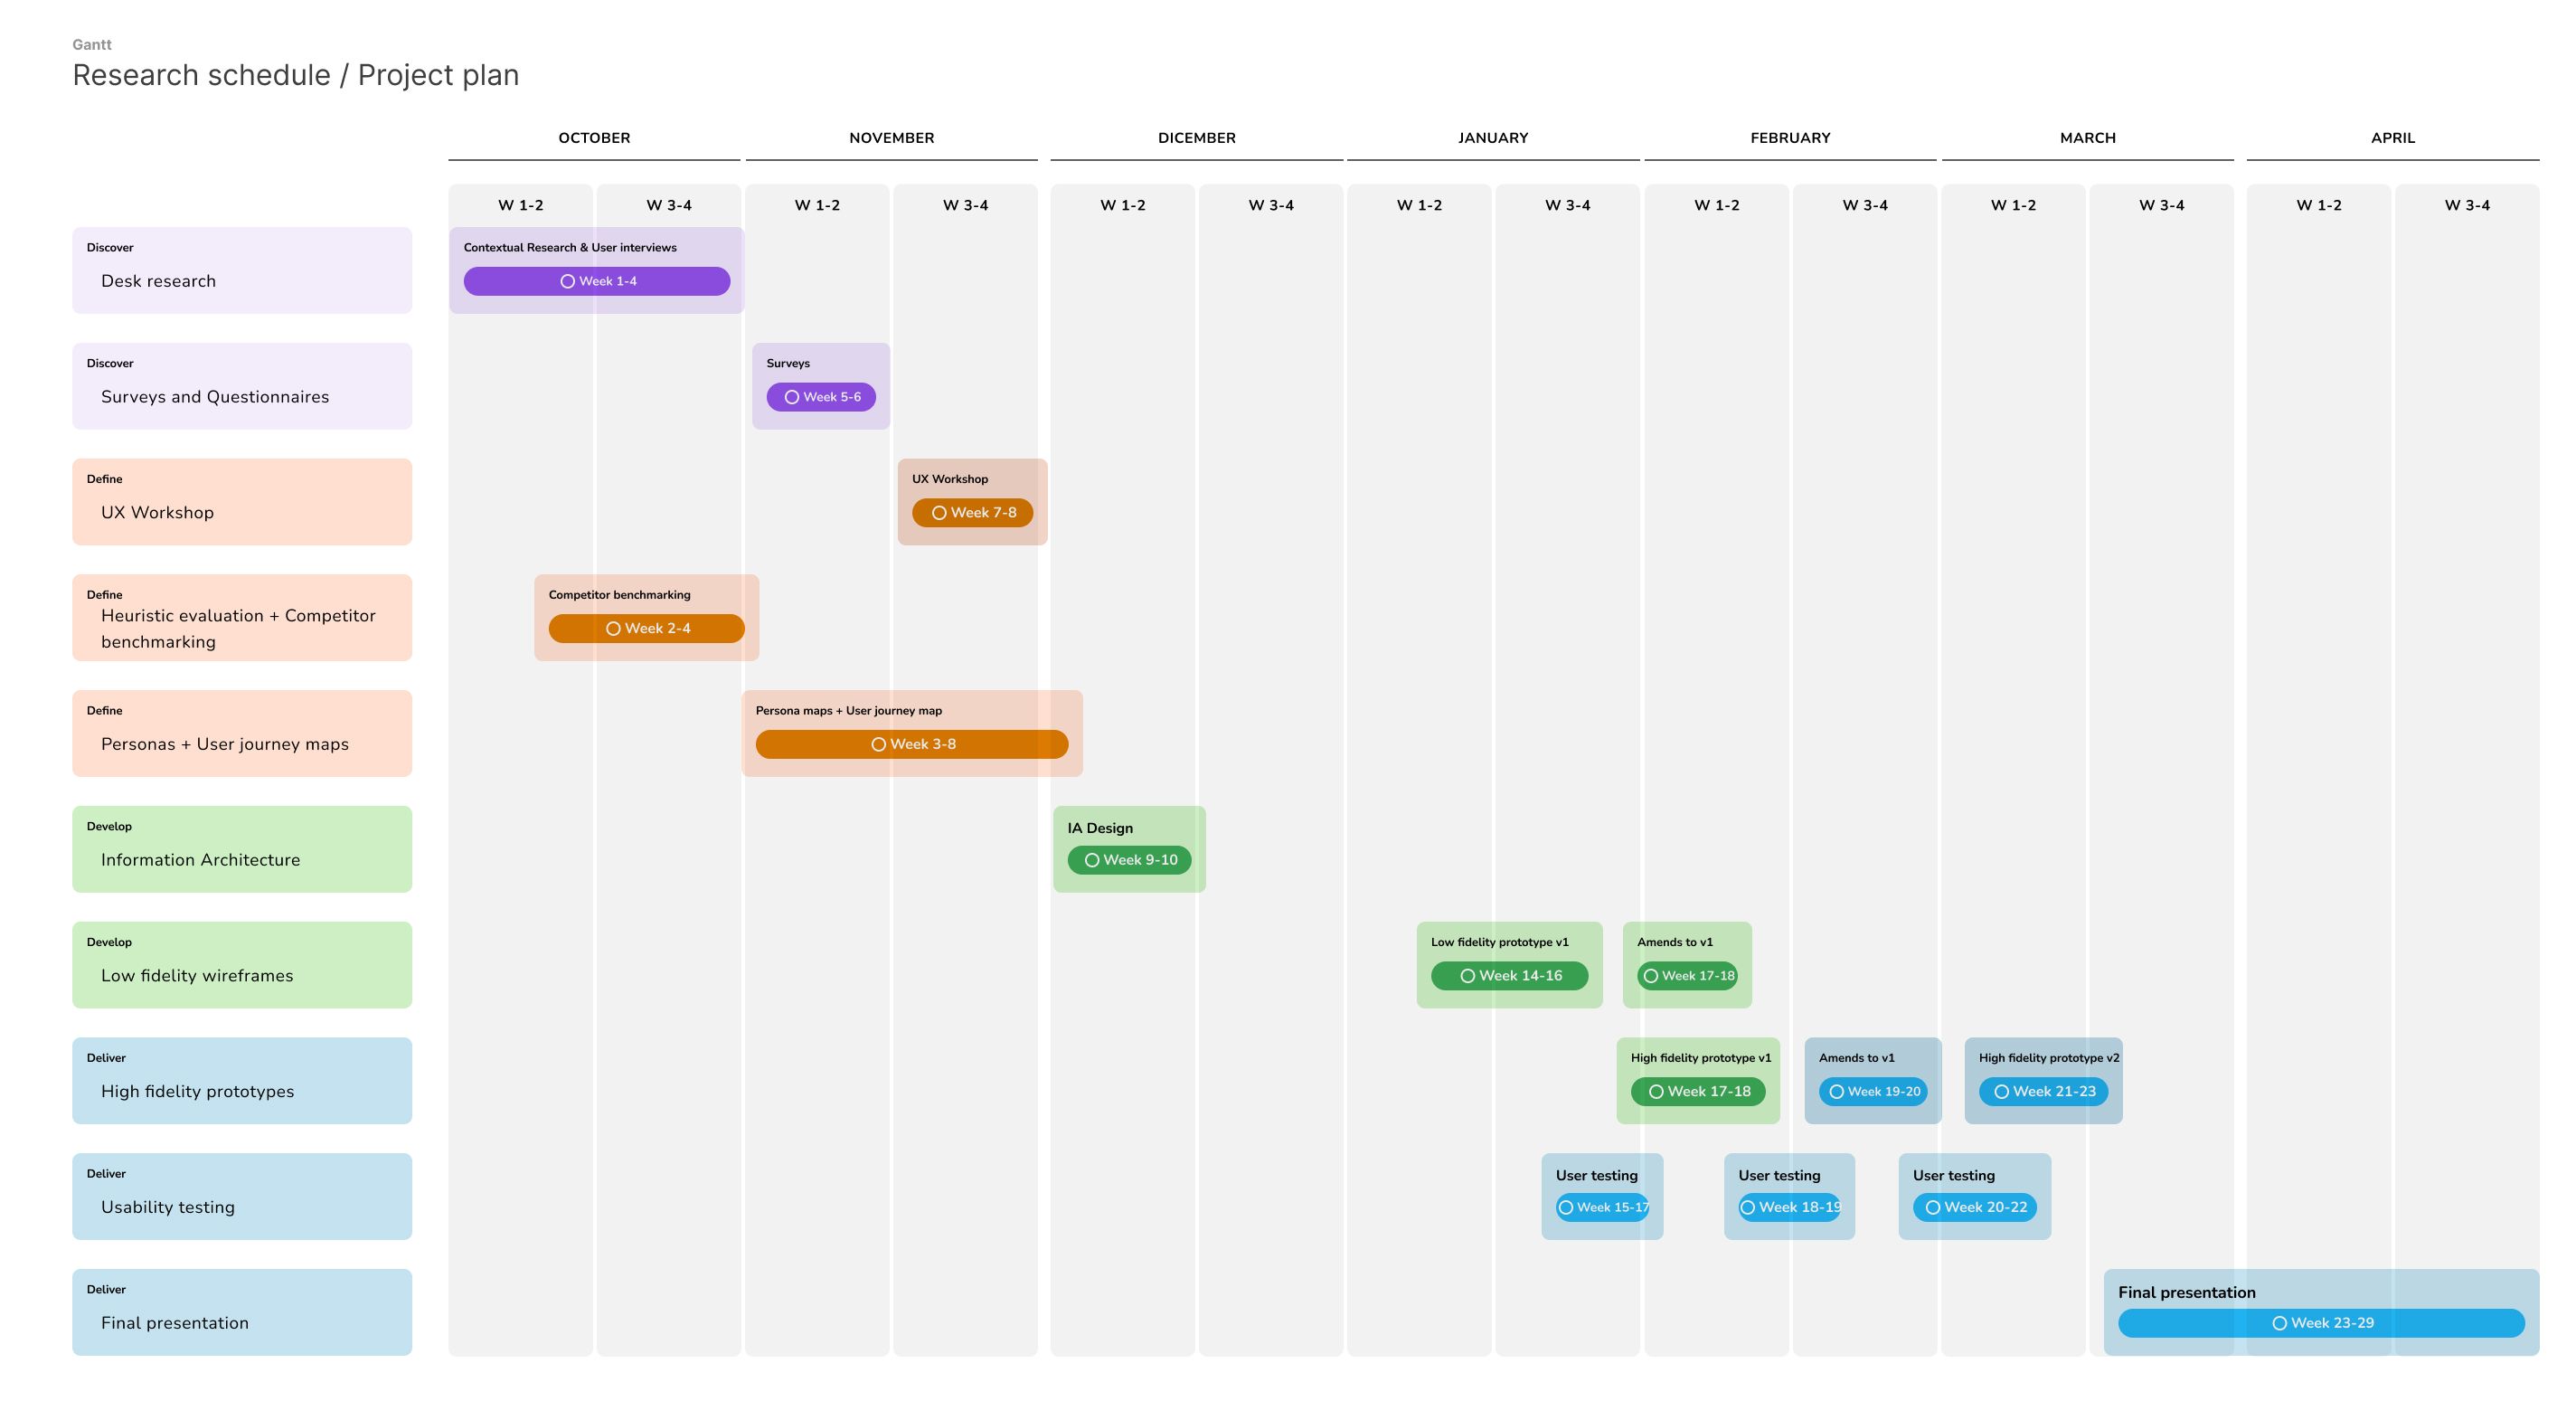

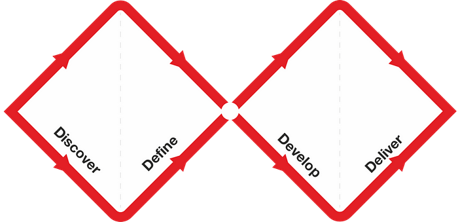
This research adopted a user-centred approach (Donald A. Norman, 1987) and was conducted between November 2024 and March 2025[1]. The framework followed the Double Diamond Process Model (British Design Council, 2005) and was carried out in four distinct phases of research. The Double Diamond framework allows to explore a wide range of ideas, narrow down to focus on the best ones and iterate quickly (Möller Ola, 2015) with the given timeline.
Surveys and usability tests were collected between November 2024 and March 2025. This period have been characterised by high market volatility for certain assets such as stocks and crypto, which could have influenced participants' risk perceptions [Madhumarthi, 1998; Diacon and Ennew, 2001; Wang et al., 2011]. As volatility reflects the unpredictability of returns and the potential for loss, it is a key factor affecting how investors perceive the risk associated with investments [Madhumarthi, 1998]. Media coverage and discussions surrounding market fluctuations during this time may have further heightened the salience of risk for the participating investors.
Phase 1: Discover
•Systematic Literature Review.
•Semi-structured User Interviews (N=12 investors)
•Pre-interview Questionnaire (demographics, financial literacy, portfolio).
•Participants: Recruited via community gatekeeper from a private investor group (purposive sampling); inclusion criteria: >2 years investing, own illiquid assets.

Phase 2: Define
- Competitor Analysis & Benchmarking (22 apps) - focused on onboarding, portfolio visualization, asset tracking, features, UI patterns.
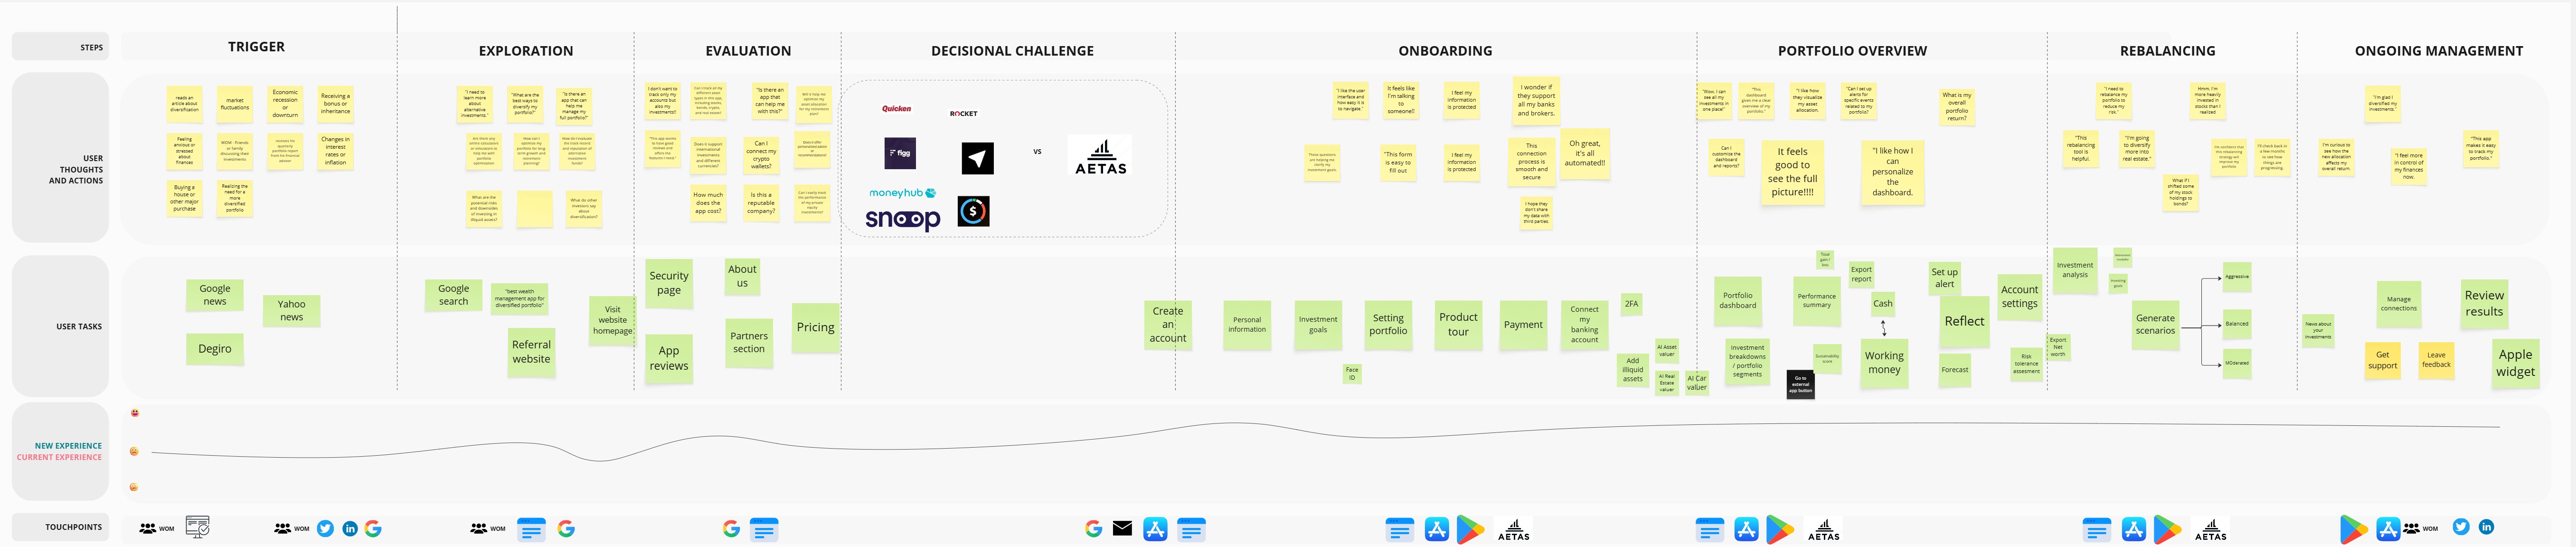
- Personas mapping
- User journey

Phase 3: Develop
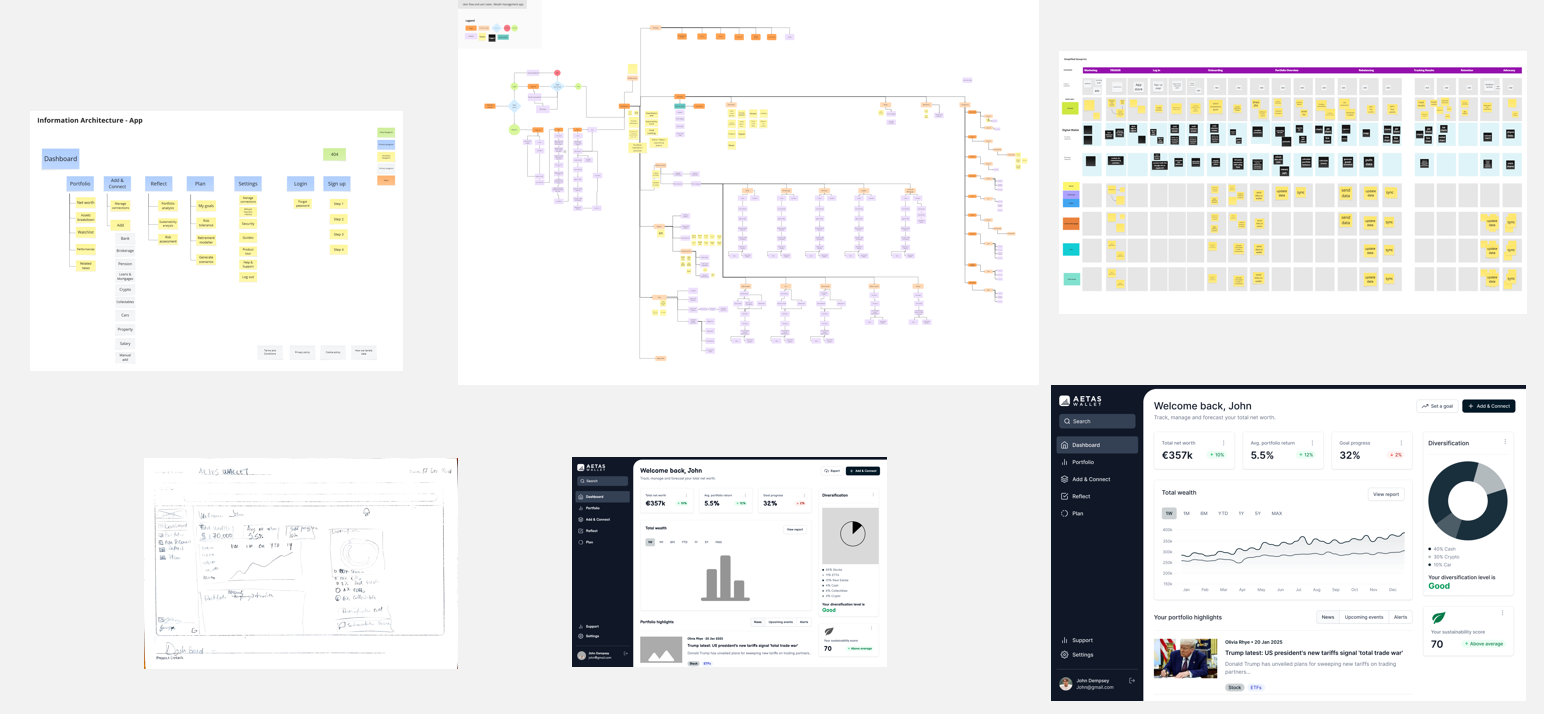
- Information Architecture (IA) & Sitemaps (Website & App)
- User Flows: Detailed flows for key tasks like registration, adding assets.
- Service Blueprint: Mapped front-end, back-end interactions, APIs, support processes.
- Paper Sketches & Low-Fidelity Prototypes: Explored concepts, tested core functions.

Phase 4: Deliver
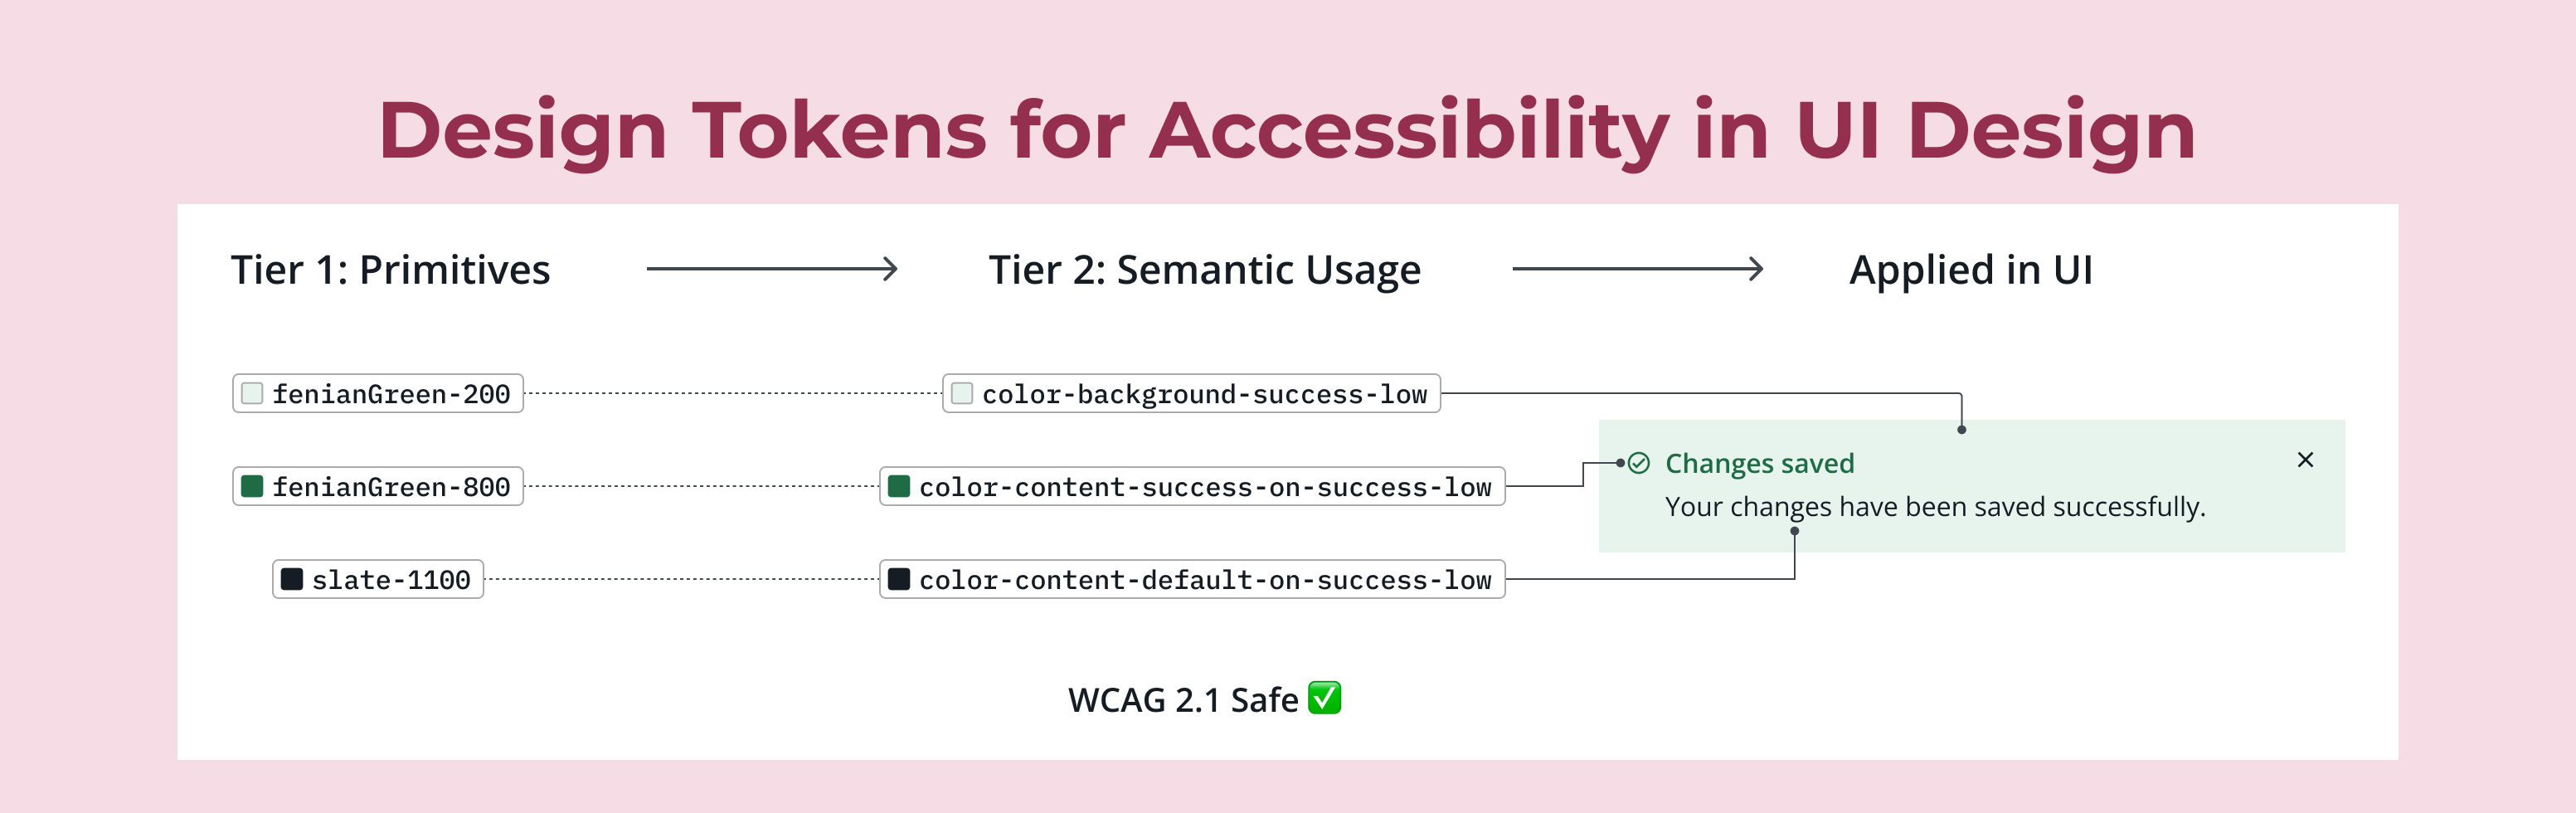
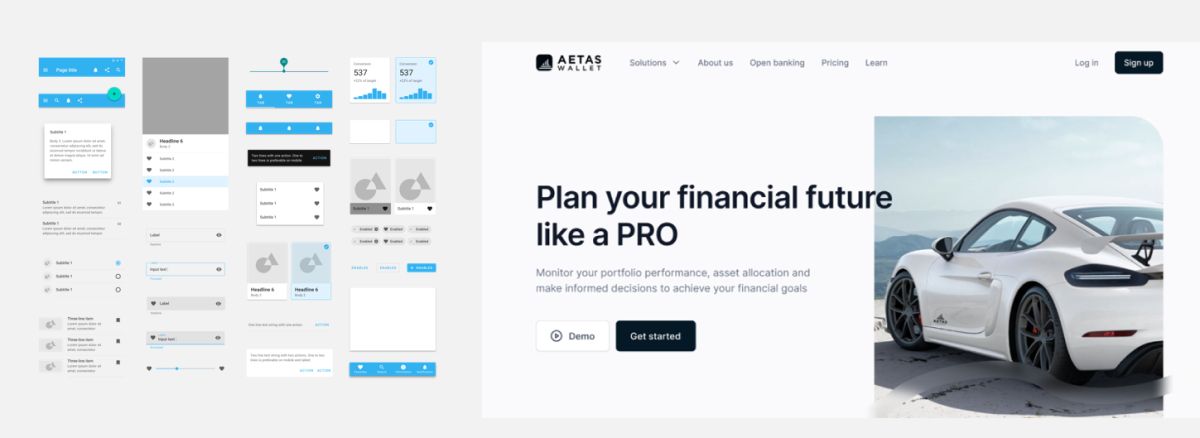
- UI Design System
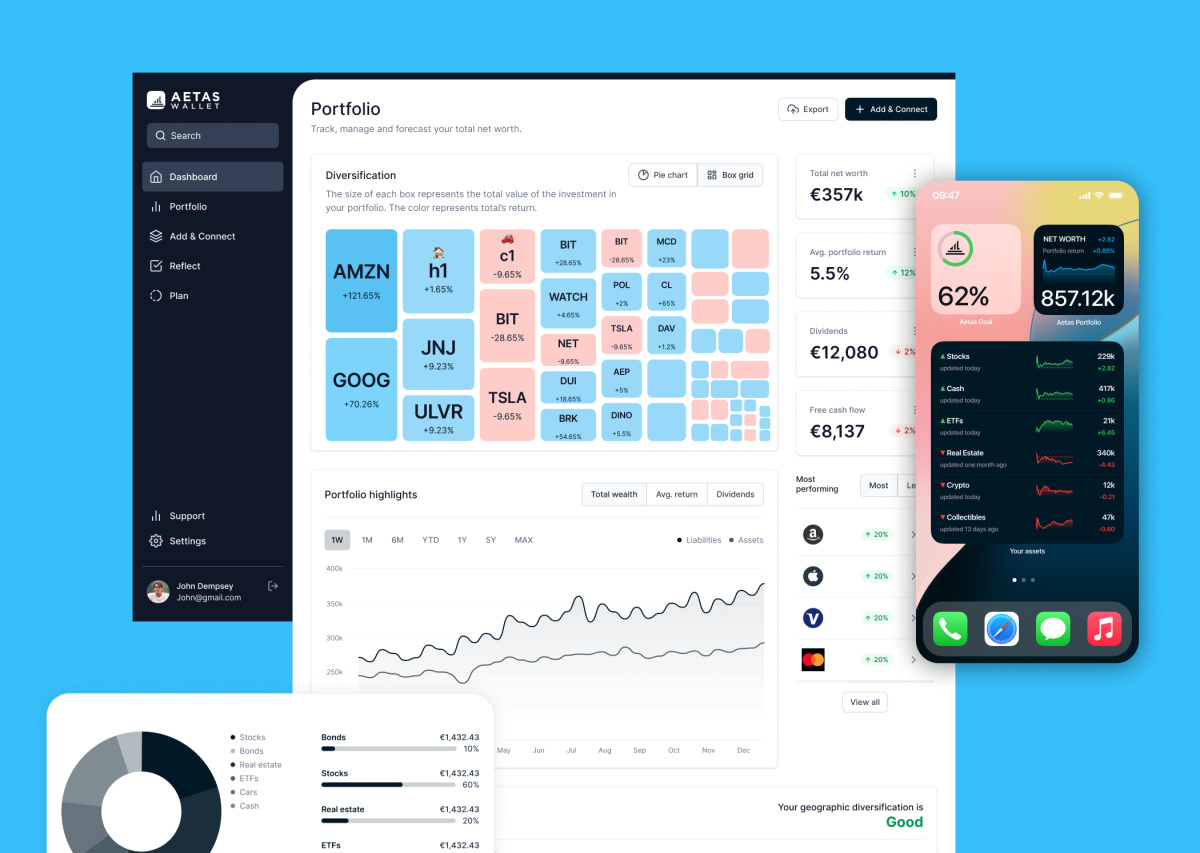
- High-Fidelity Prototype ("Aetas Wallet"): Developed iteratively based on user testing feedback; applied design guidelines. Desktop-first. Play the prototype
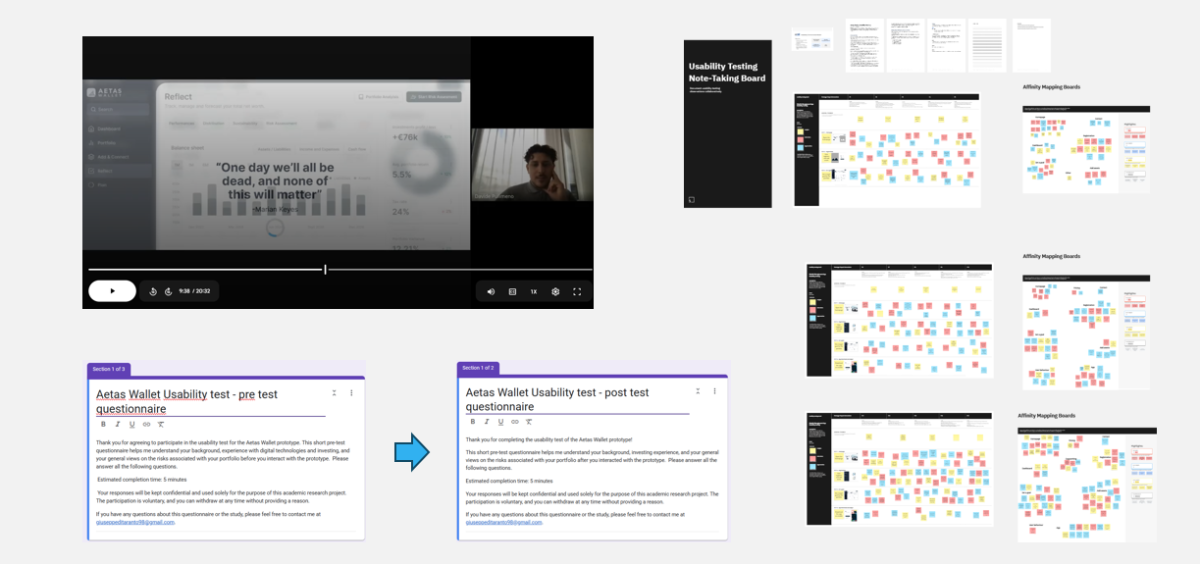
- Iterative Usability Testing (N=15 total across iterations): Tested low-fi and hi-fi prototypes. Pilot testing (N=5) refined tasks/surveys.
- Final Moderated Usability Test (N=7 active investors):
- Procedure: Consent, pre-test survey, screen-sharing with prototype interaction (personalized), task completion, post-test survey + SUS.
- Pre/Post-Test Questionnaires: Measured perceived risk change using adapted psychometric scales. Questions rotated to reduce bias.
- System Usability Scale (SUS): Measured usability post-interaction.


To examine how investors perceive risk when liquid and illiquid assets are aggregated and visualized in a unified wealth management app prototype, and to assess the app's usability.
Research questions
1. Would the user-perceived risk change after using an holistic wealth management app with various liquid and illiquid asset classes?
2. How easy and usable is a holistic wealth management app from a user’s perspective? What is the user experience of adding illiquid assets to an investment portfolio management app?
The participants to the final test consisted of 7 adults (7 males) with good self-reported financial ability and good perceived Financial Sophistication/Financial literacy.
An analysis of the variation of the perceived risk pre and post usability testing revealed significant differences in perceived risk ratings for the investor portfolio, M= 0.7731092437, S.D. 0.32623
The results indicate that the variation in perceived risk is 12.89%.
Based on the initial research, the hypothesis (Hn) formulated for the study are the following:
H1: The perceived risk profile of the investor portfolio (measured using a Likert scale analysis of 17 risk-related questions to determine the function R, which numerically represent the perceived risk ) will differ significantly after the user registers and visualizes his whole portfolio on the app compared to the portfolio risk perception before using the app.
The correlation between the System Usability Scale and the function R was futher explored.
Hi, I'm Giuseppe, an X-shaped UX designer focused on Interaction Design and Conversion Optimization.
Curious and problem-solver by nature, I love to know why, how, who... and walk in other’s people shoes while materializing my concepts.