Reuben Maher
This study explores how users with low graphical literacy (LGL) understand data visualisations, particularly in fitness apps, and whether design interventions, like simplified visuals and gamification, can improve comprehension and motivation. With up to a third of the population struggling to interpret visual data, and many fitness apps relying heavily on charts and graphs, this gap in understanding may contribute to the high abandonment rates of wearable fitness devices.
Up to one third of the population experience some form of graphical literacy issues.
What is low graphical literacy?
Low graphical literacy is a term to describe a user who is more likely to identify and analyse incorrect parts of their visualised data, usually ending up misunderstanding the presented data.
My initial question
Why is my fitness data so confusing and is it confusing for anyone else?
This led me to explore low graphical literacy
The approach
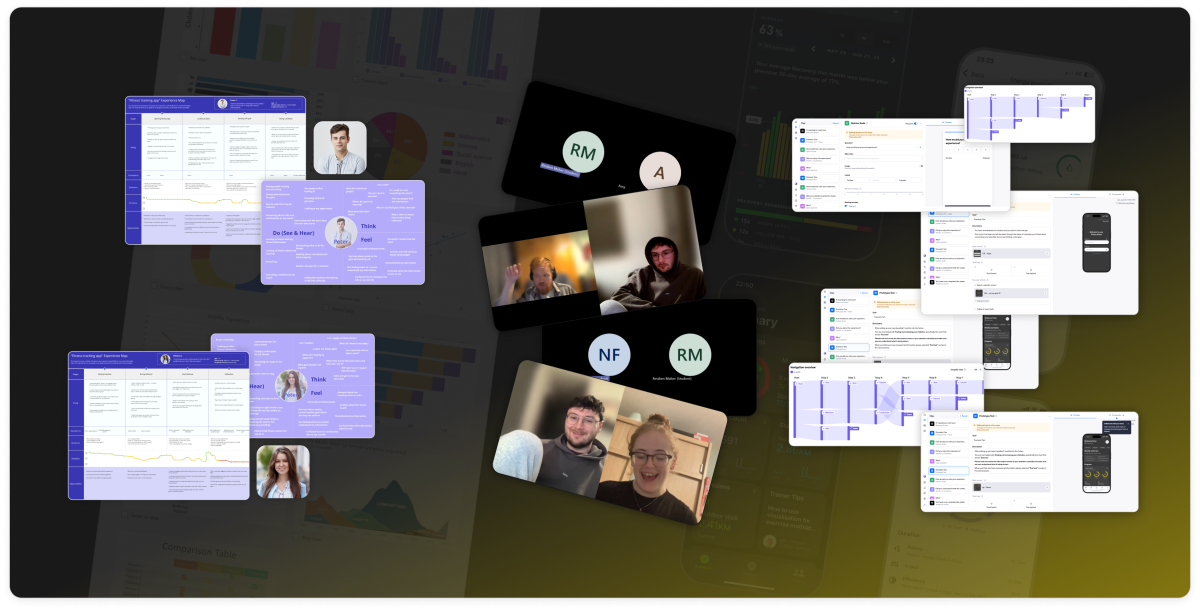
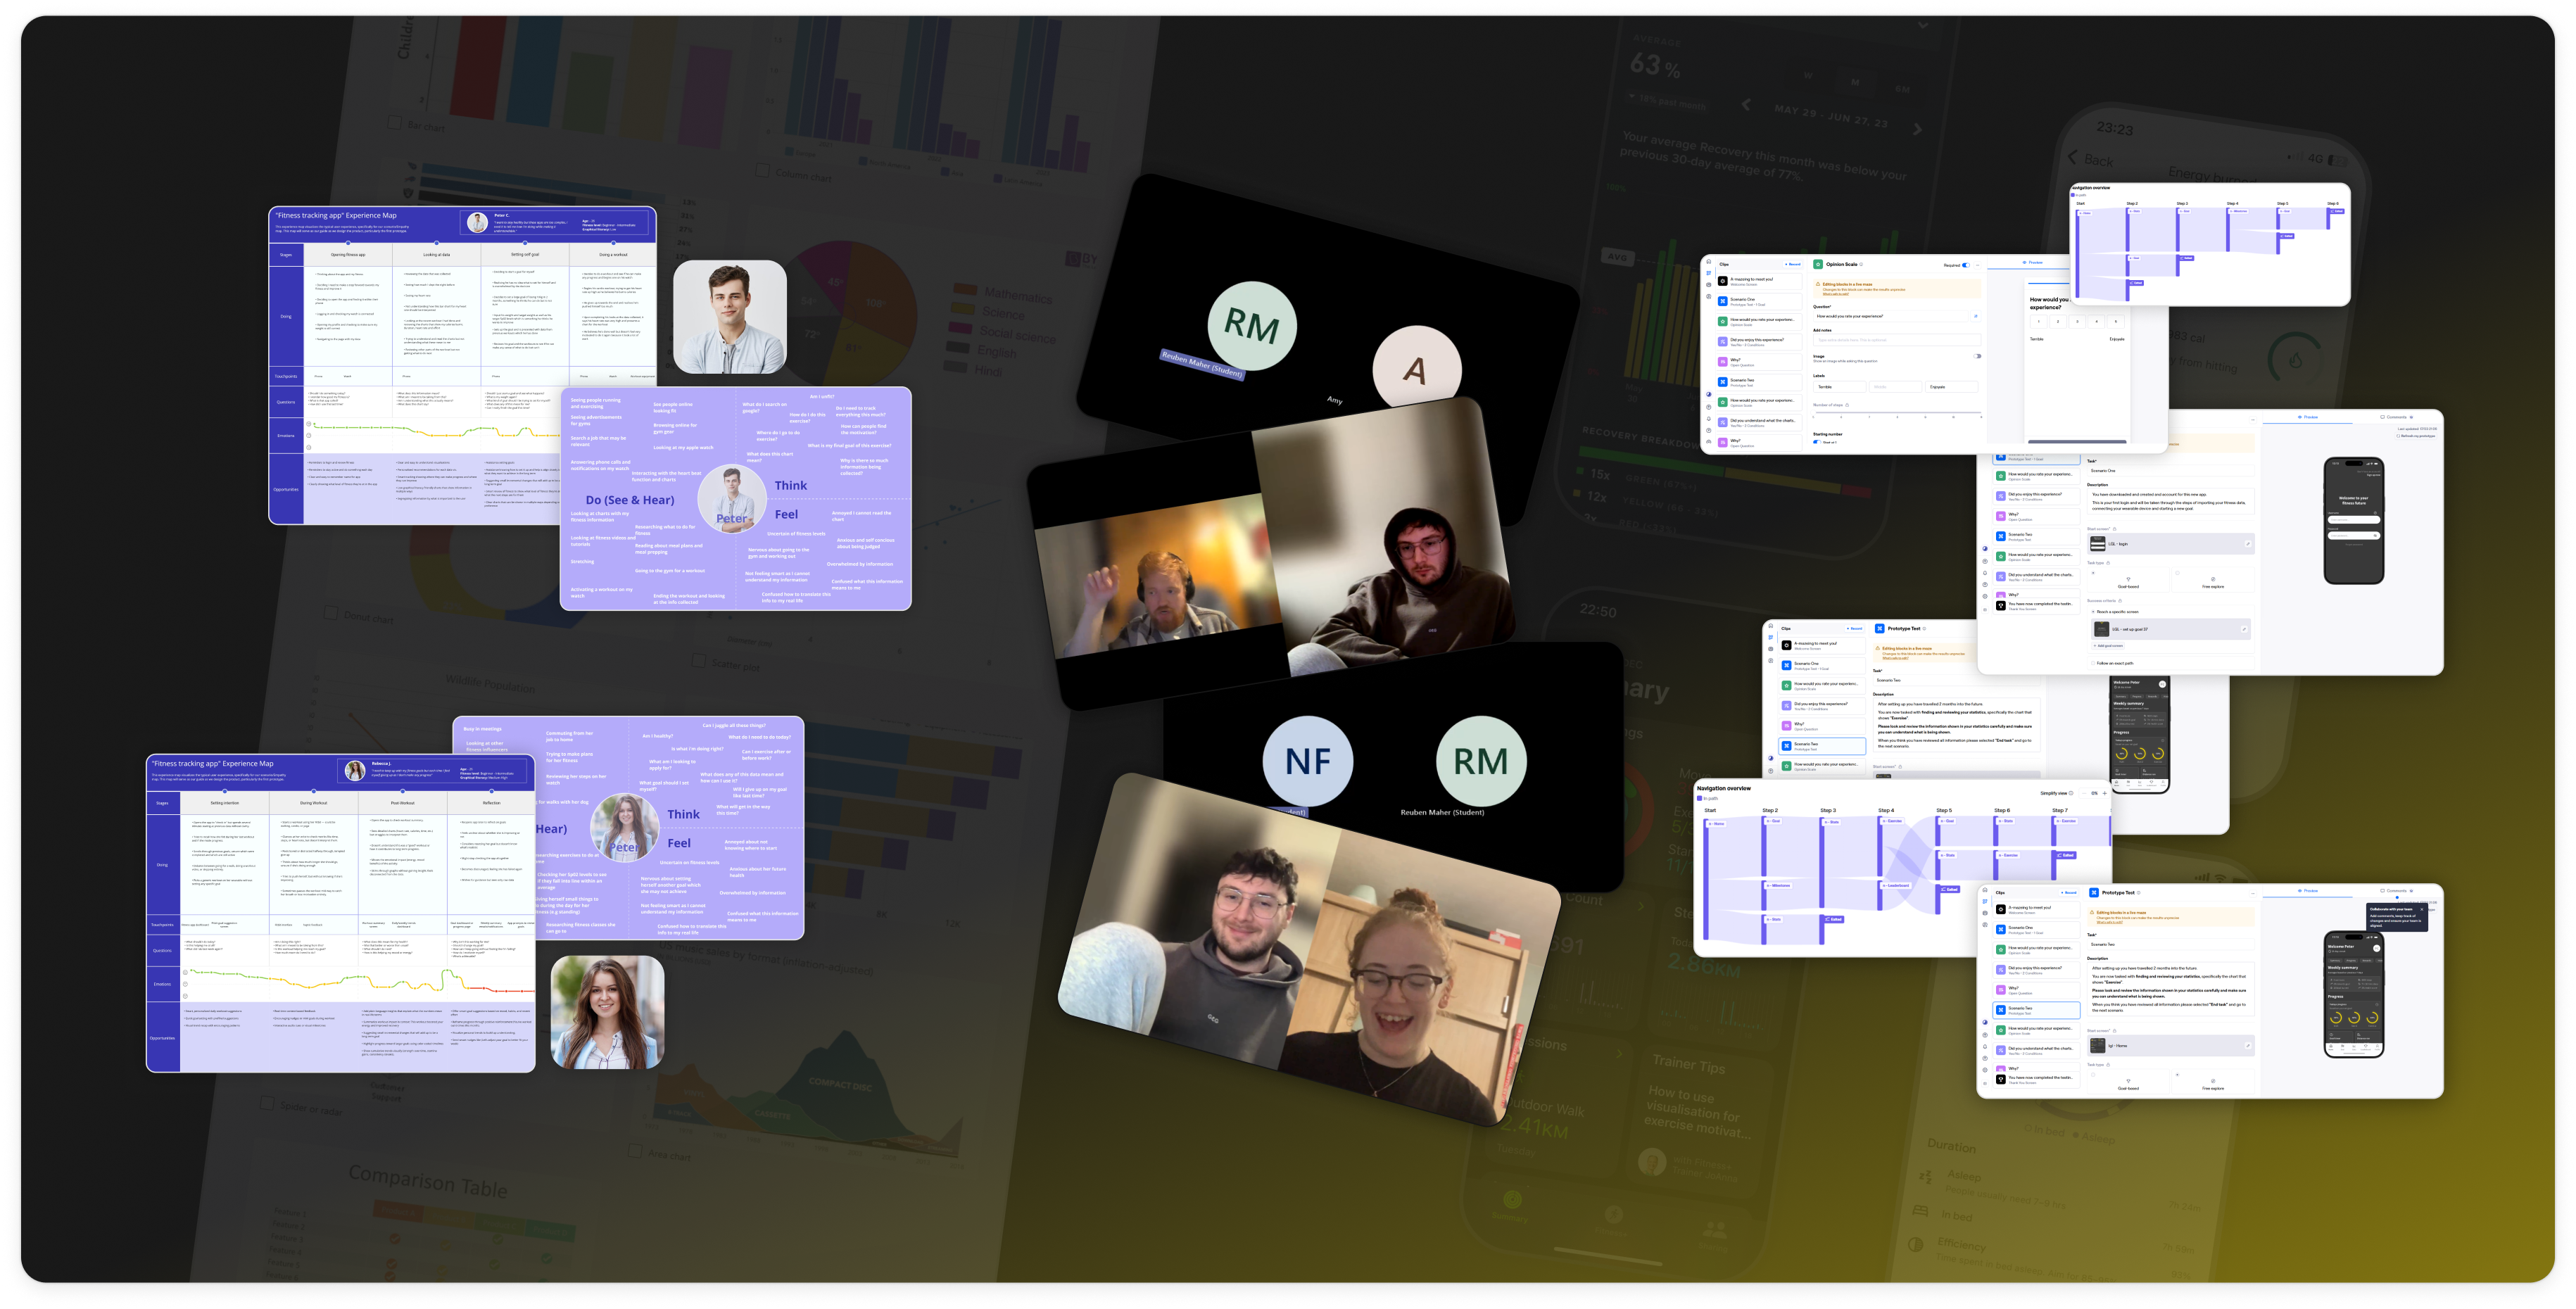
The “Design thinking process” was chosen as the structure of the research. This process can be broken down into five stages: empathise, define, ideate, prototype and test. Chosen for its robust and linear approach, this process allows abstract and multifaceted problems to be solved systematically while also allowing flexibility to the problem itself.
Process
- Surveys
- Interviews
- Competitive analysis
- Personas
- Empathy maps
- User experience maps
- Pilot testing
- Unstructured user testing
- A/B testing
Analysis
The Intrinsic Motivation Inventory (IMI) is a multifaceted approach to measuring and assessing participants’ experiences through a test. The IMI was chosen due to its ability to measure subjective experience, based on Self-Determination Theory (SDT), the IMI is a proven method to measure motivation and engagement. This was used to measure four subscales to confirm the initial research questions.
What good is fitness data if you can’t understand it? It's confusion not laziness and is a major reason why users abandon their devices


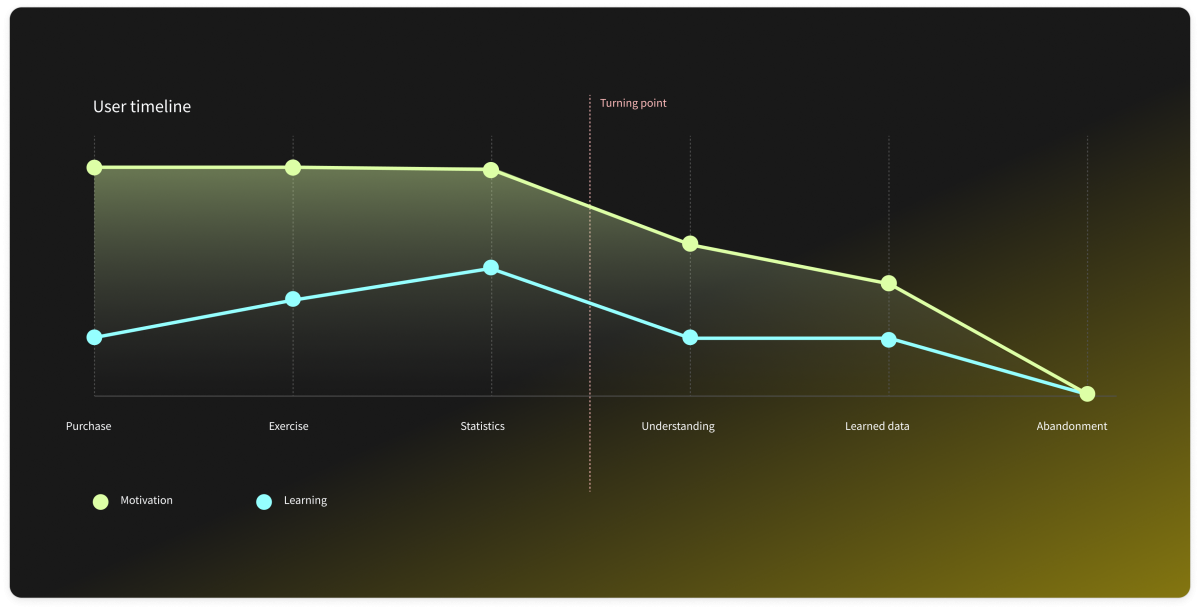
Timeline of a user
On initial purchase of a fitness wearable motivation is high and knowledge is basic, following exercise and review of statistics a noticeable turning point is prevalent. As a user reviews their statistics their perceived knowledge increases, although when reviewing they aren't learning anything new and a turning point is reached. The users motivation and learning decreases due to a lack of understanding and learned data which leads to the ending point which is abandonment.
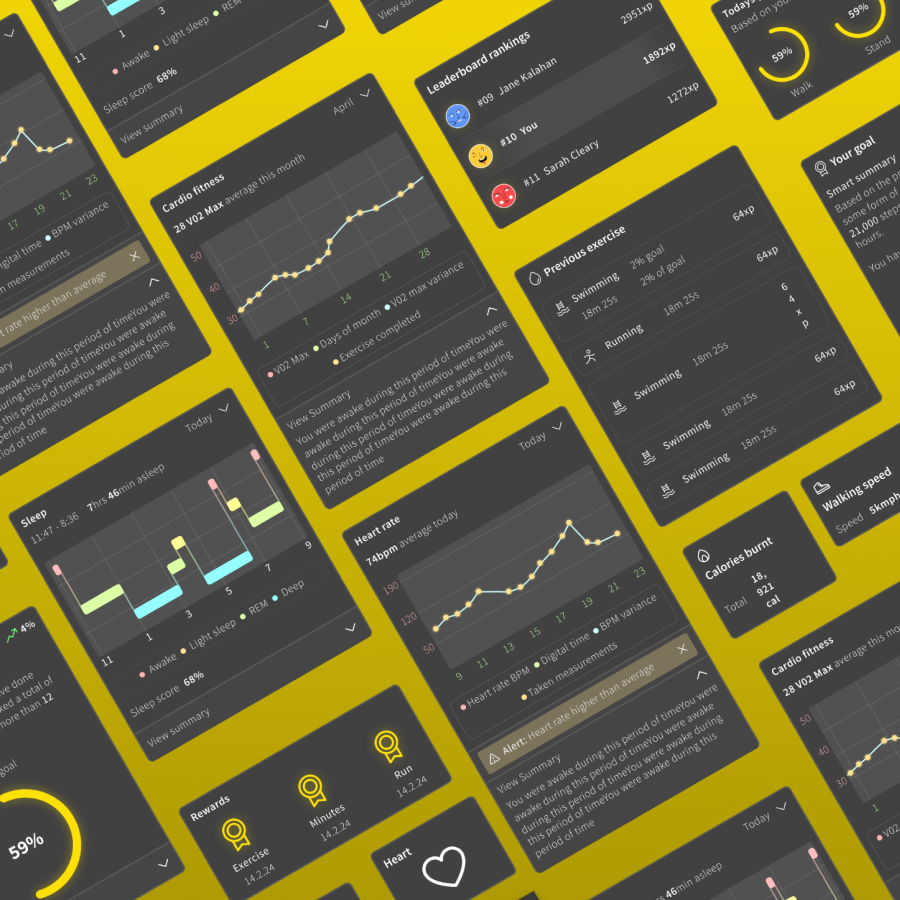
What were the low graphical literacy interventions?
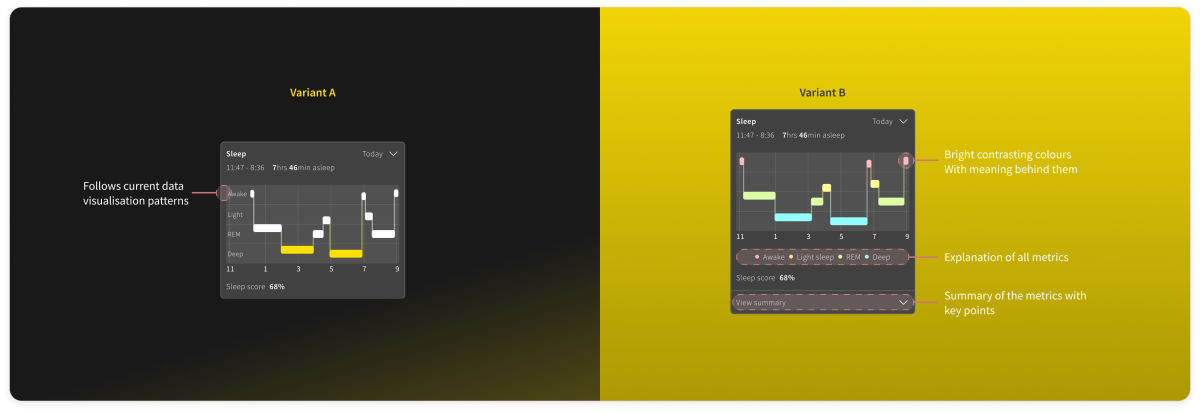
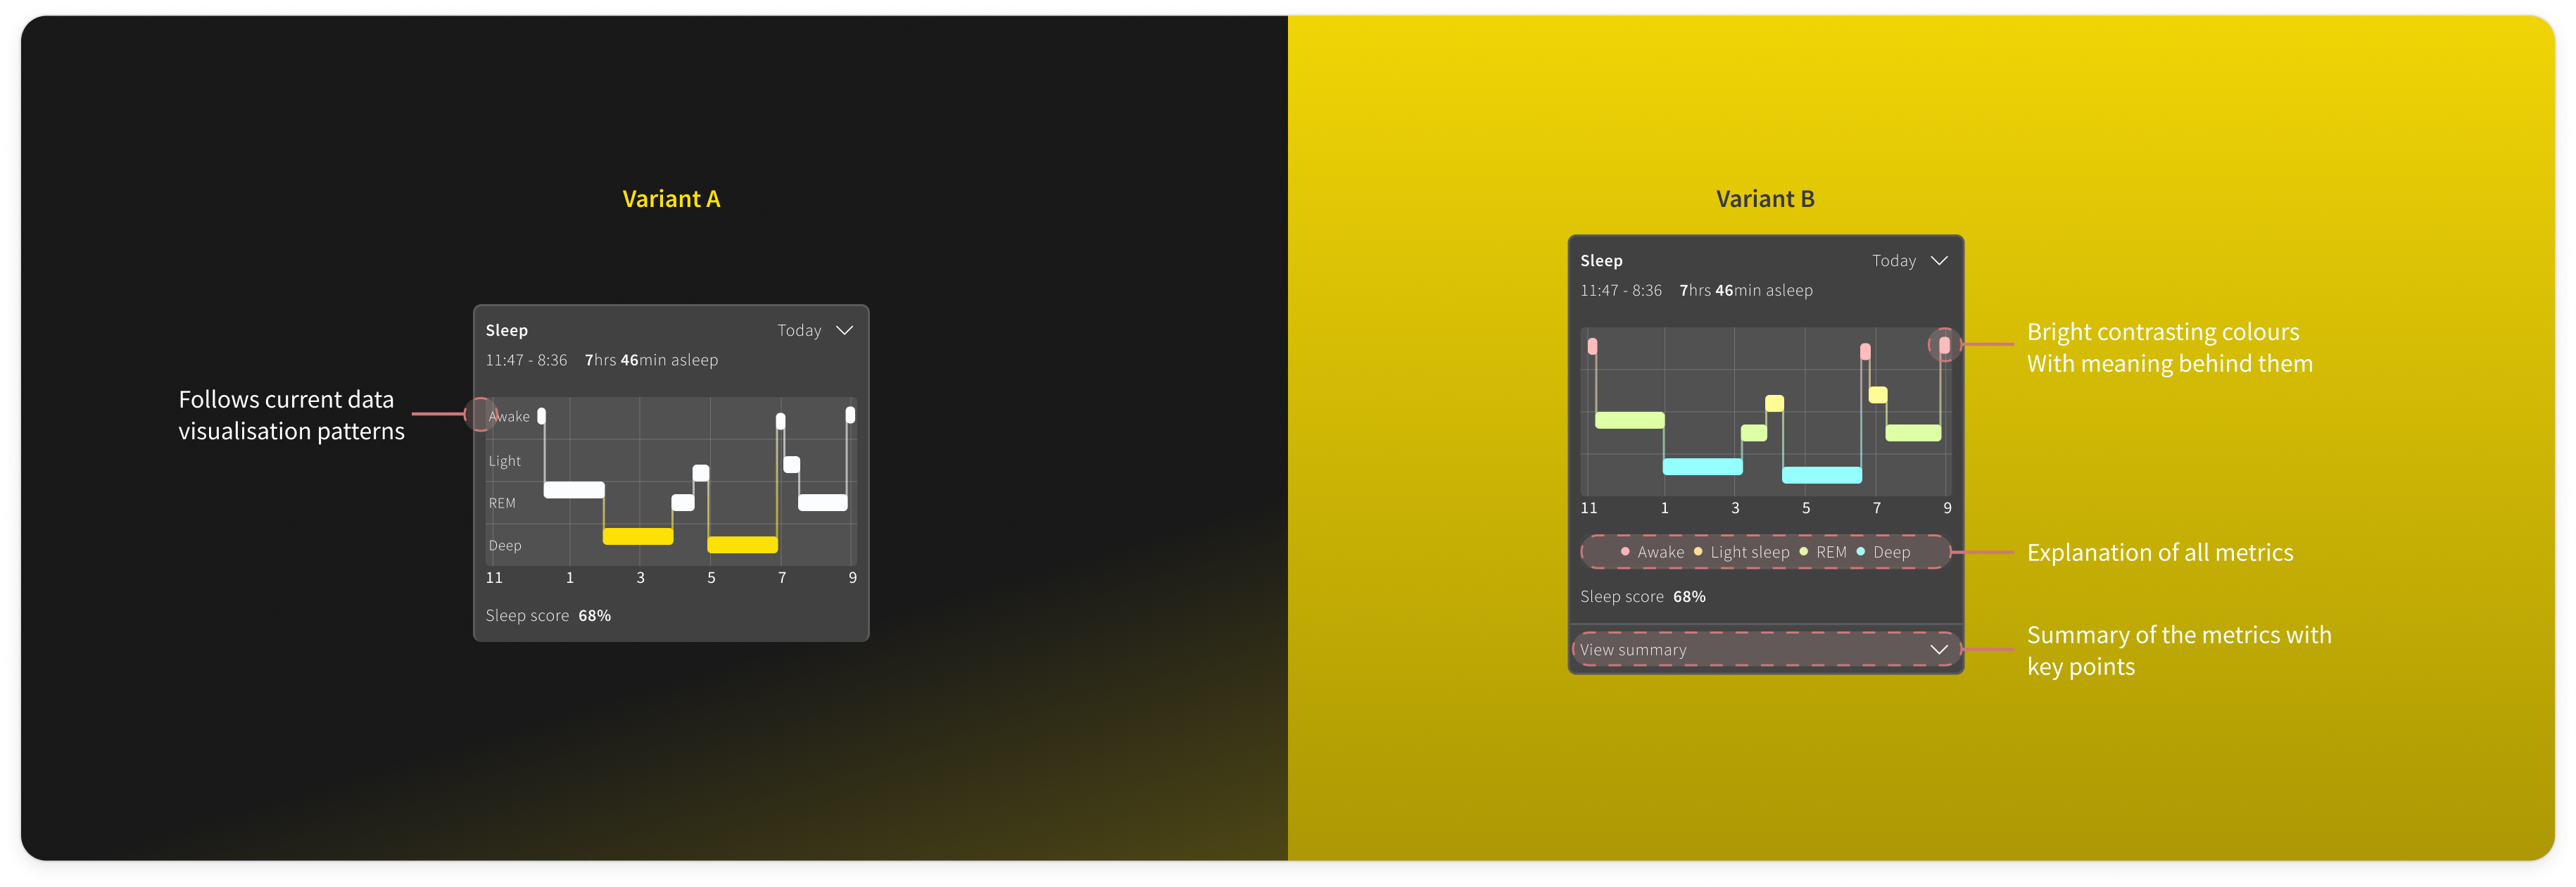
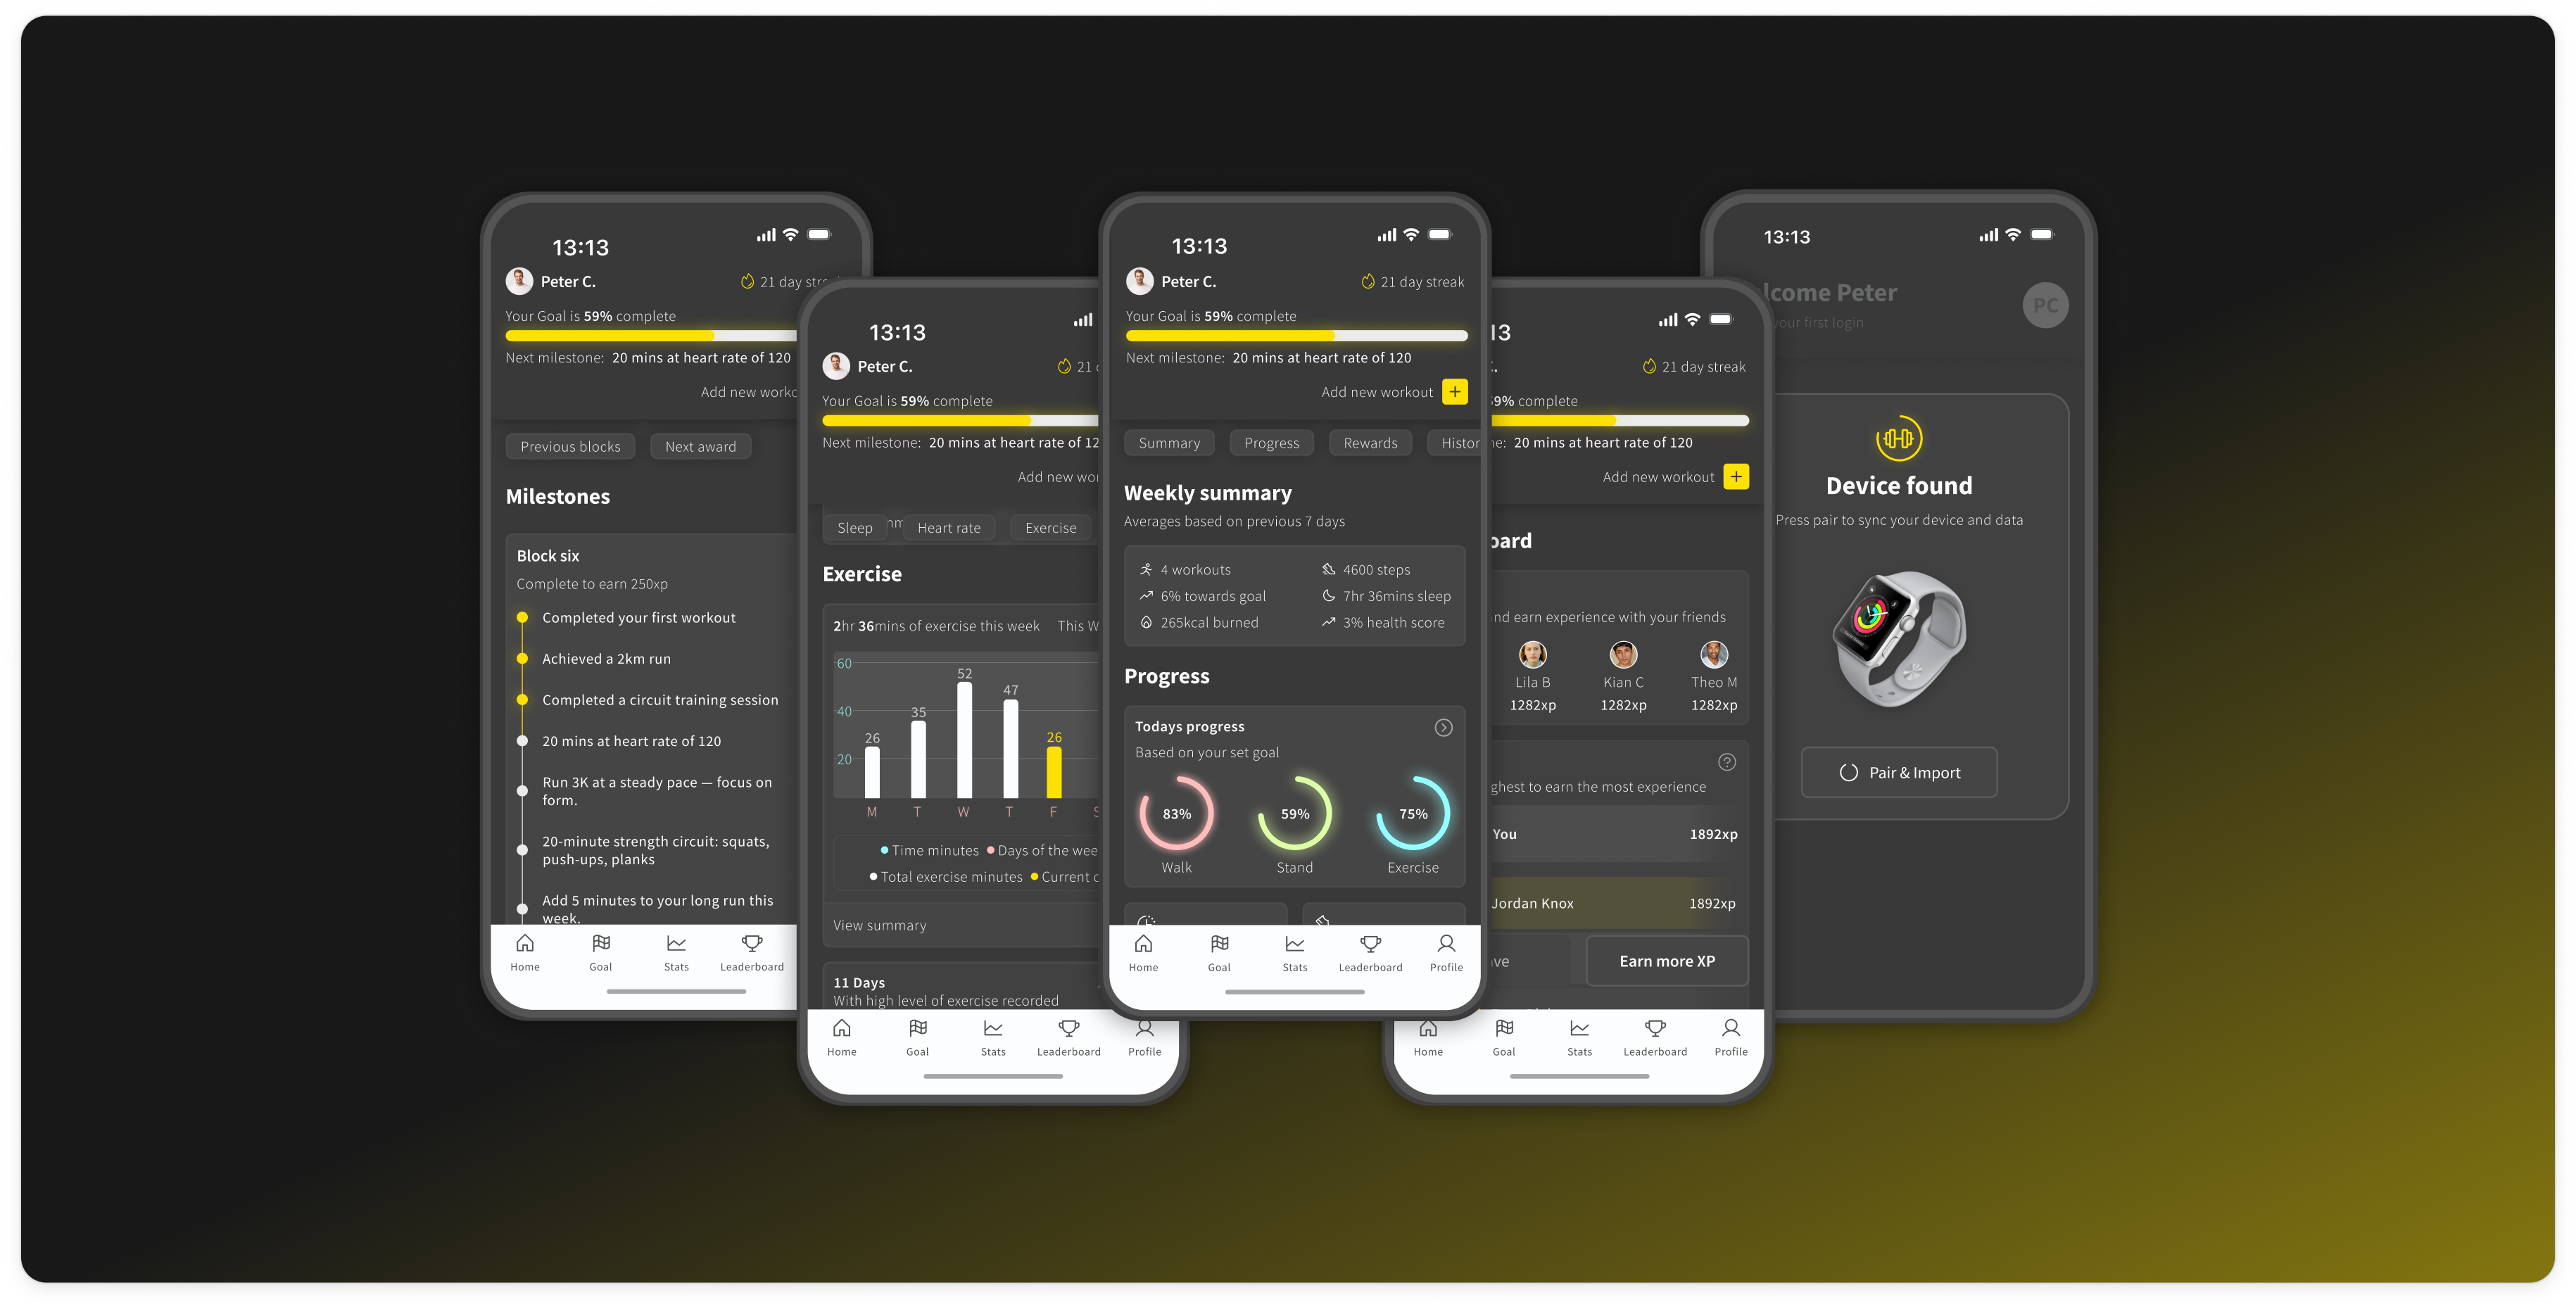
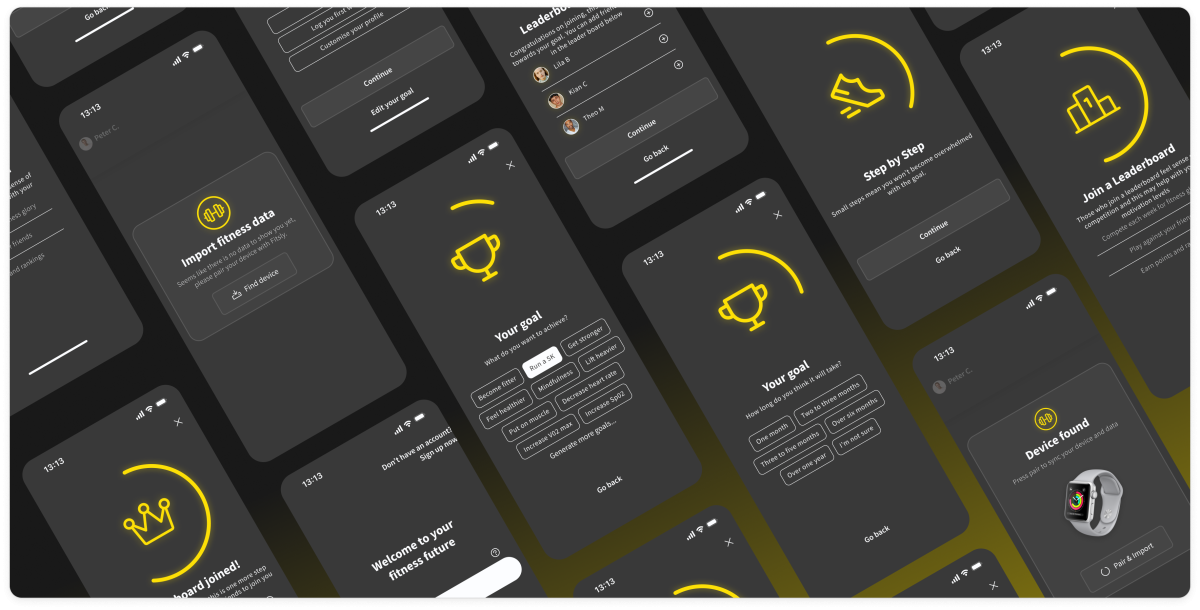
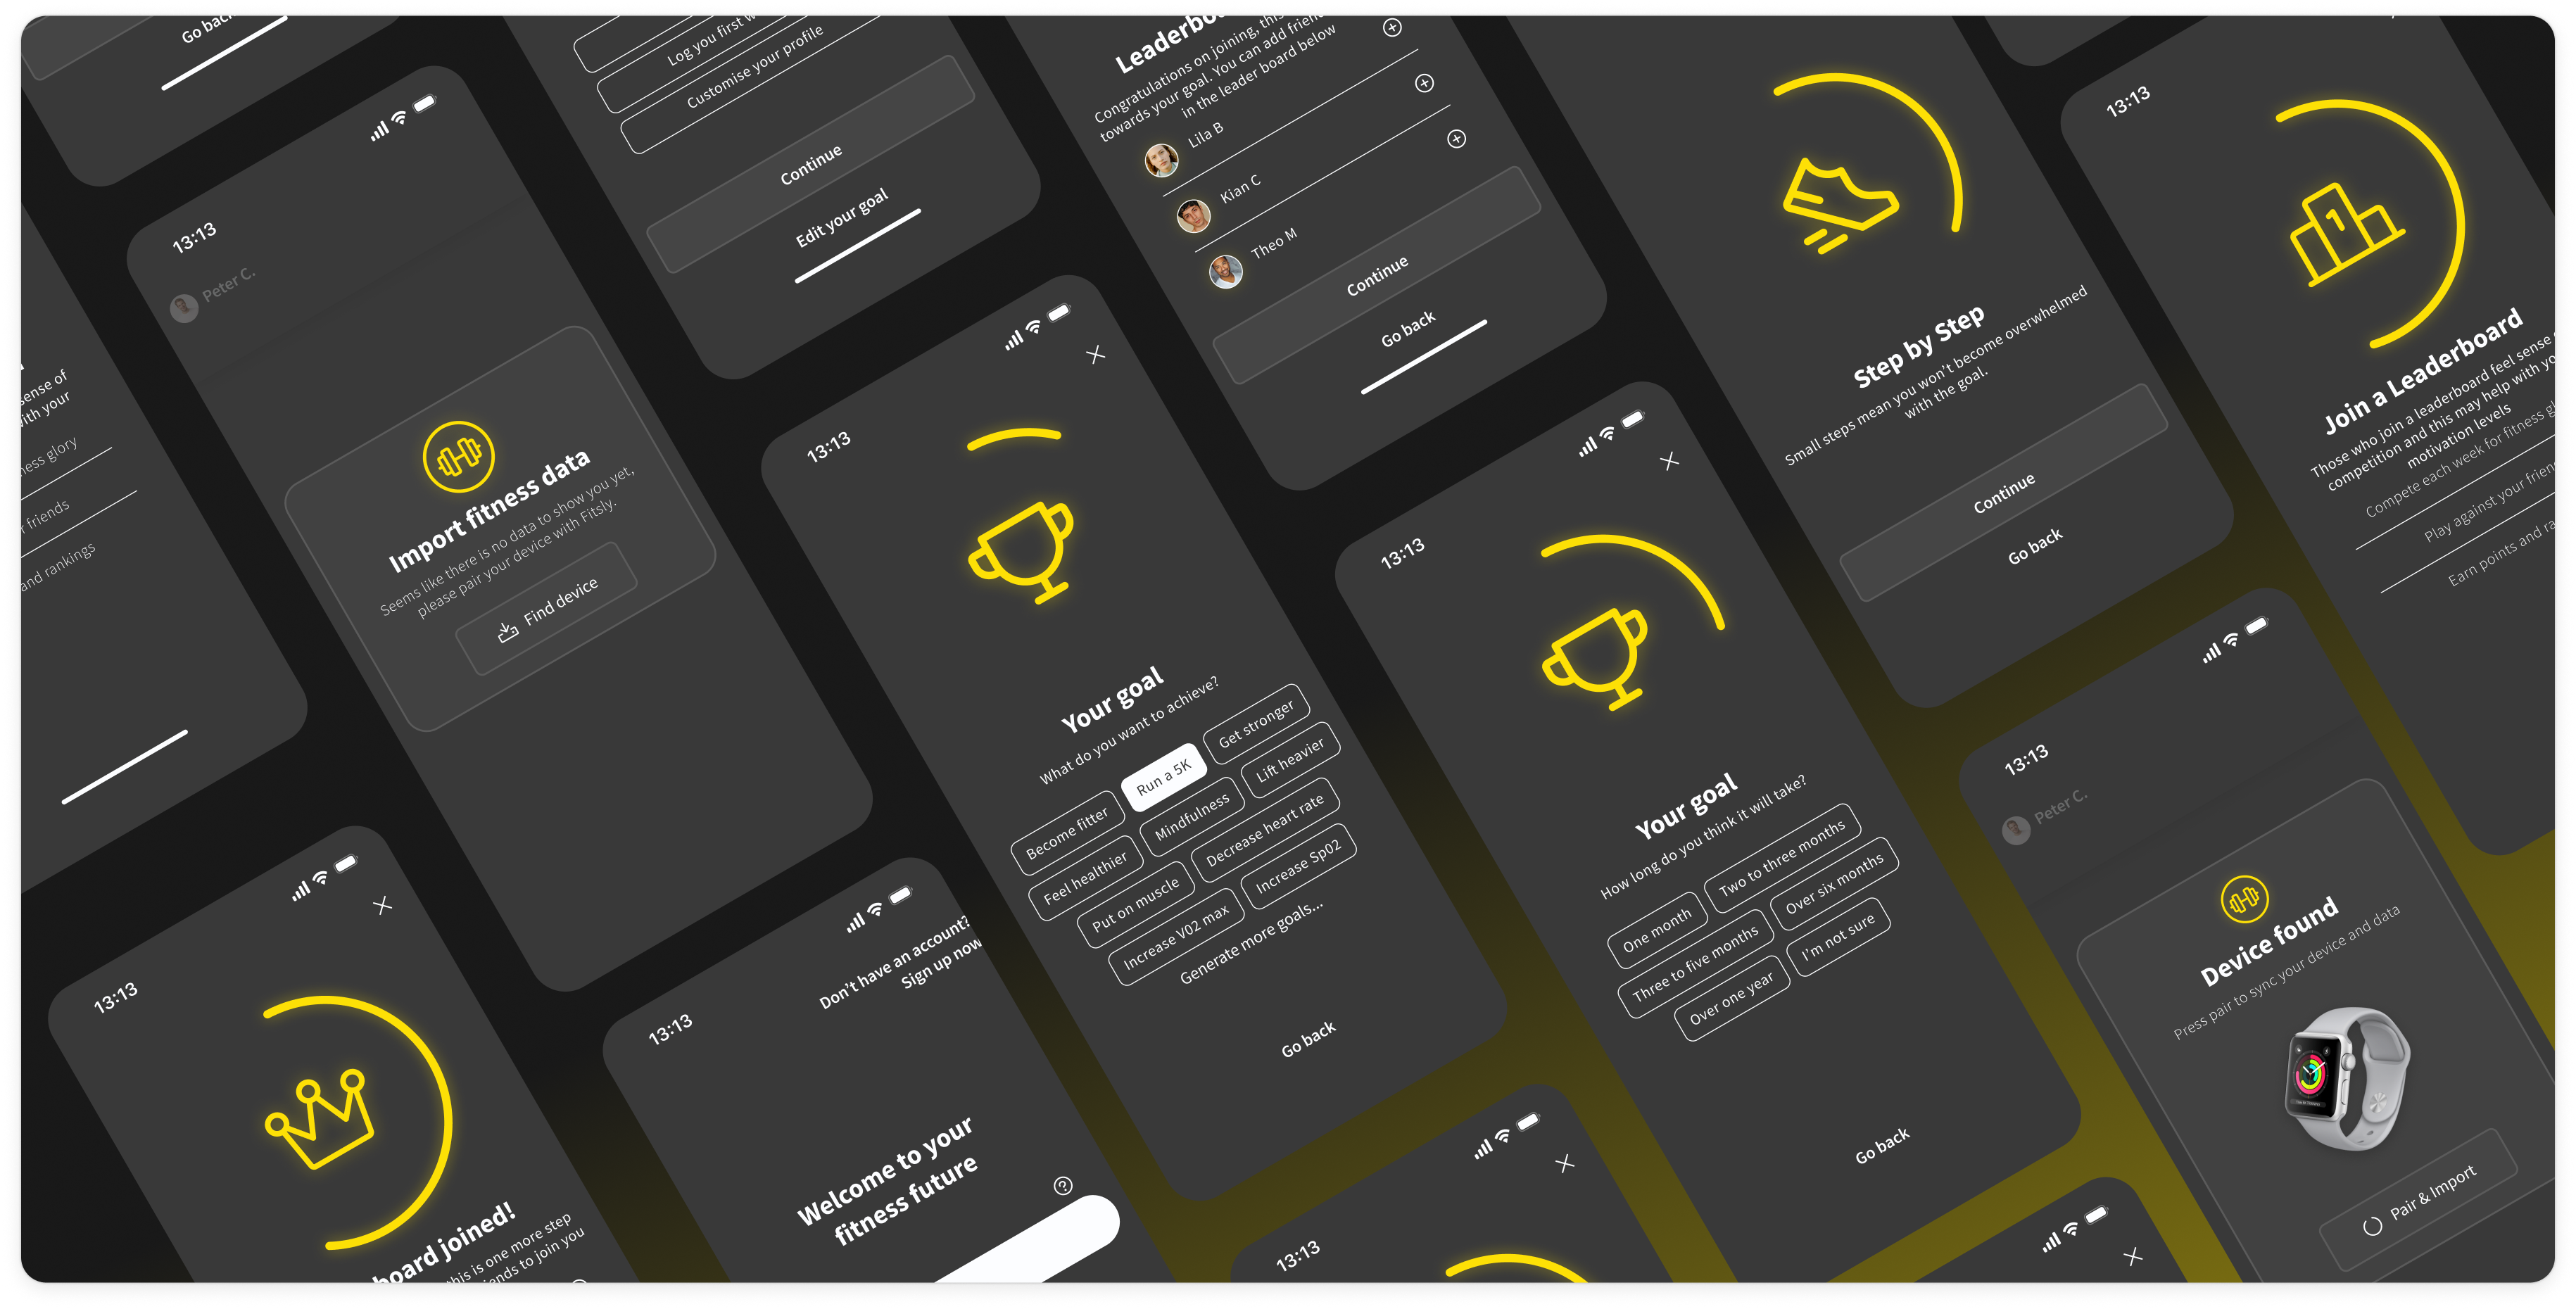
The current data visualisations were assessed and recreated for variant A, this was used during the testing as the control. As there is little research in the area of low graphical literacy in design considerations such for accessibility and how a LGL user perceives theses data visualisations were implemented. The are within variant B and can be summarised to contrasting colours, descriptions of data within the visualisation, and a summary of the data visualisation.
The app
This short video will go through the low graphical literacy specific app, starting with the onboarding and then once completed it skips two months into the future when data is available to be shown.
Low graphical literacy interventions positively impacted comprehension
Conclusion
All three research questions were answered, and the three hypotheses were confirmed and supported by the analysed data. In summary, LGL interventions to data visualisations positively impacted both LGL and HGL users, with gamified elements also supporting users’ intrinsic motivation. Therefore, the inclusion of these elements should be a consideration for the future development of fitness applications.
Impact
The findings of this research suggest there remains a large gap within this area of study, as there is sparse research on how to assist LGL users. Although there is a large set of research to identify LGL predominantly within school children, there remains a lack of identification within adults. Furthermore, there are few tests to identify LGL, with ambiguity on how to score or measure them. Therefore, larger amounts of research are required in multiple areas to be able to confidently design for this user type.

Can the inclusion of low graphical literacy interventions within data visualisations improve a user’s comprehension, compared to those without intervention?
Can the integration of gamification elements improve a user’s engagement and intrinsic motivation when interacting with a fitness specific application?
Do data visualisations with low graphical literacy interventions also assist users with higher graphical understanding comprehend their fitness data?
Low graphical literacy interventions to data visualisations improved comprehension
Gamification elements improved motivation
Low graphical literacy interventions did not negatively impact user with high graphical literacy
I'm a UX designer with a passion for creating inclusive digital experiences that prioritize accessibility and intuitive interaction. With a background in both product design and UX, I thrive on solving complex problems through creative thinking and empathetic design. I believe that great design is not only beautiful but also functional and equitable, and I’m driven by the challenge of making technology more usable and enjoyable for everyone.