Profile image in black and white of Kostandinos Hodaj

Kostandinos Hodaj

Evaluation of the impact of gamification and digital nudges on household food waste reduction

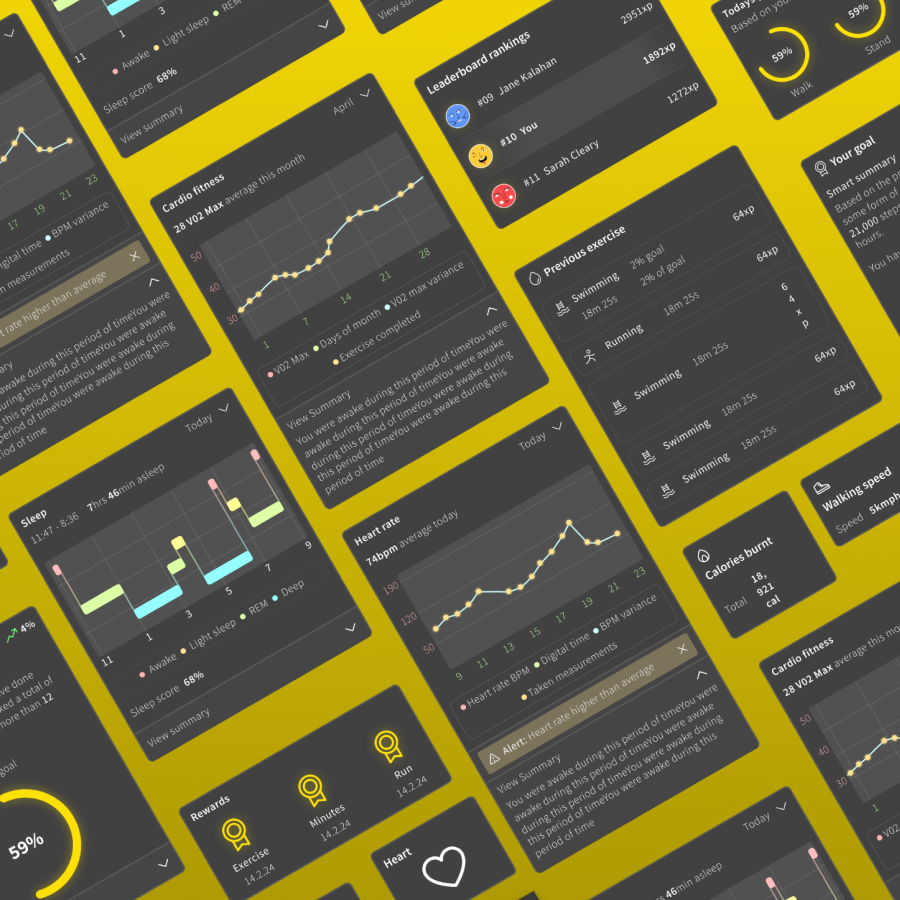
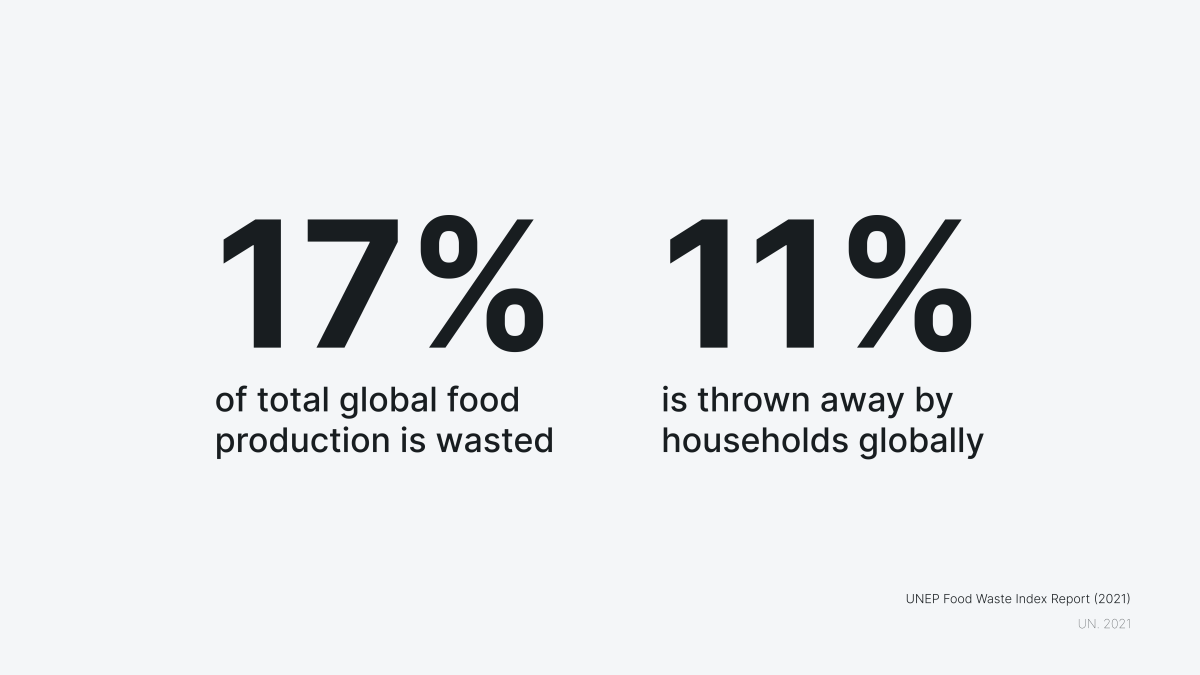
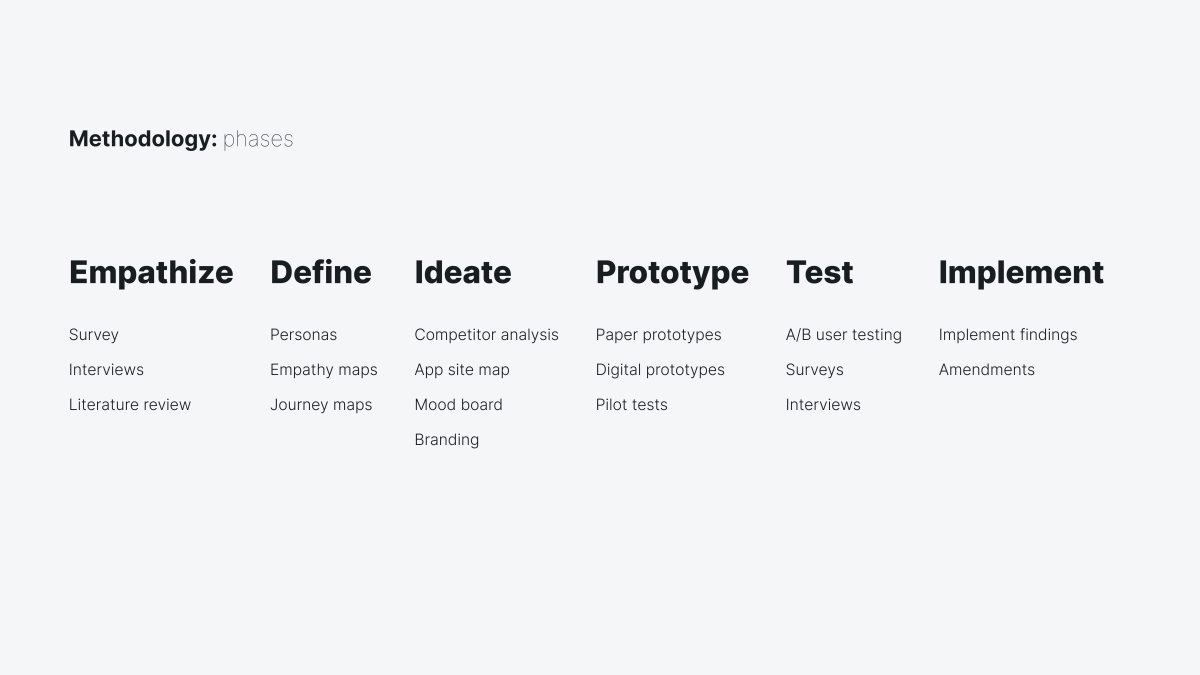
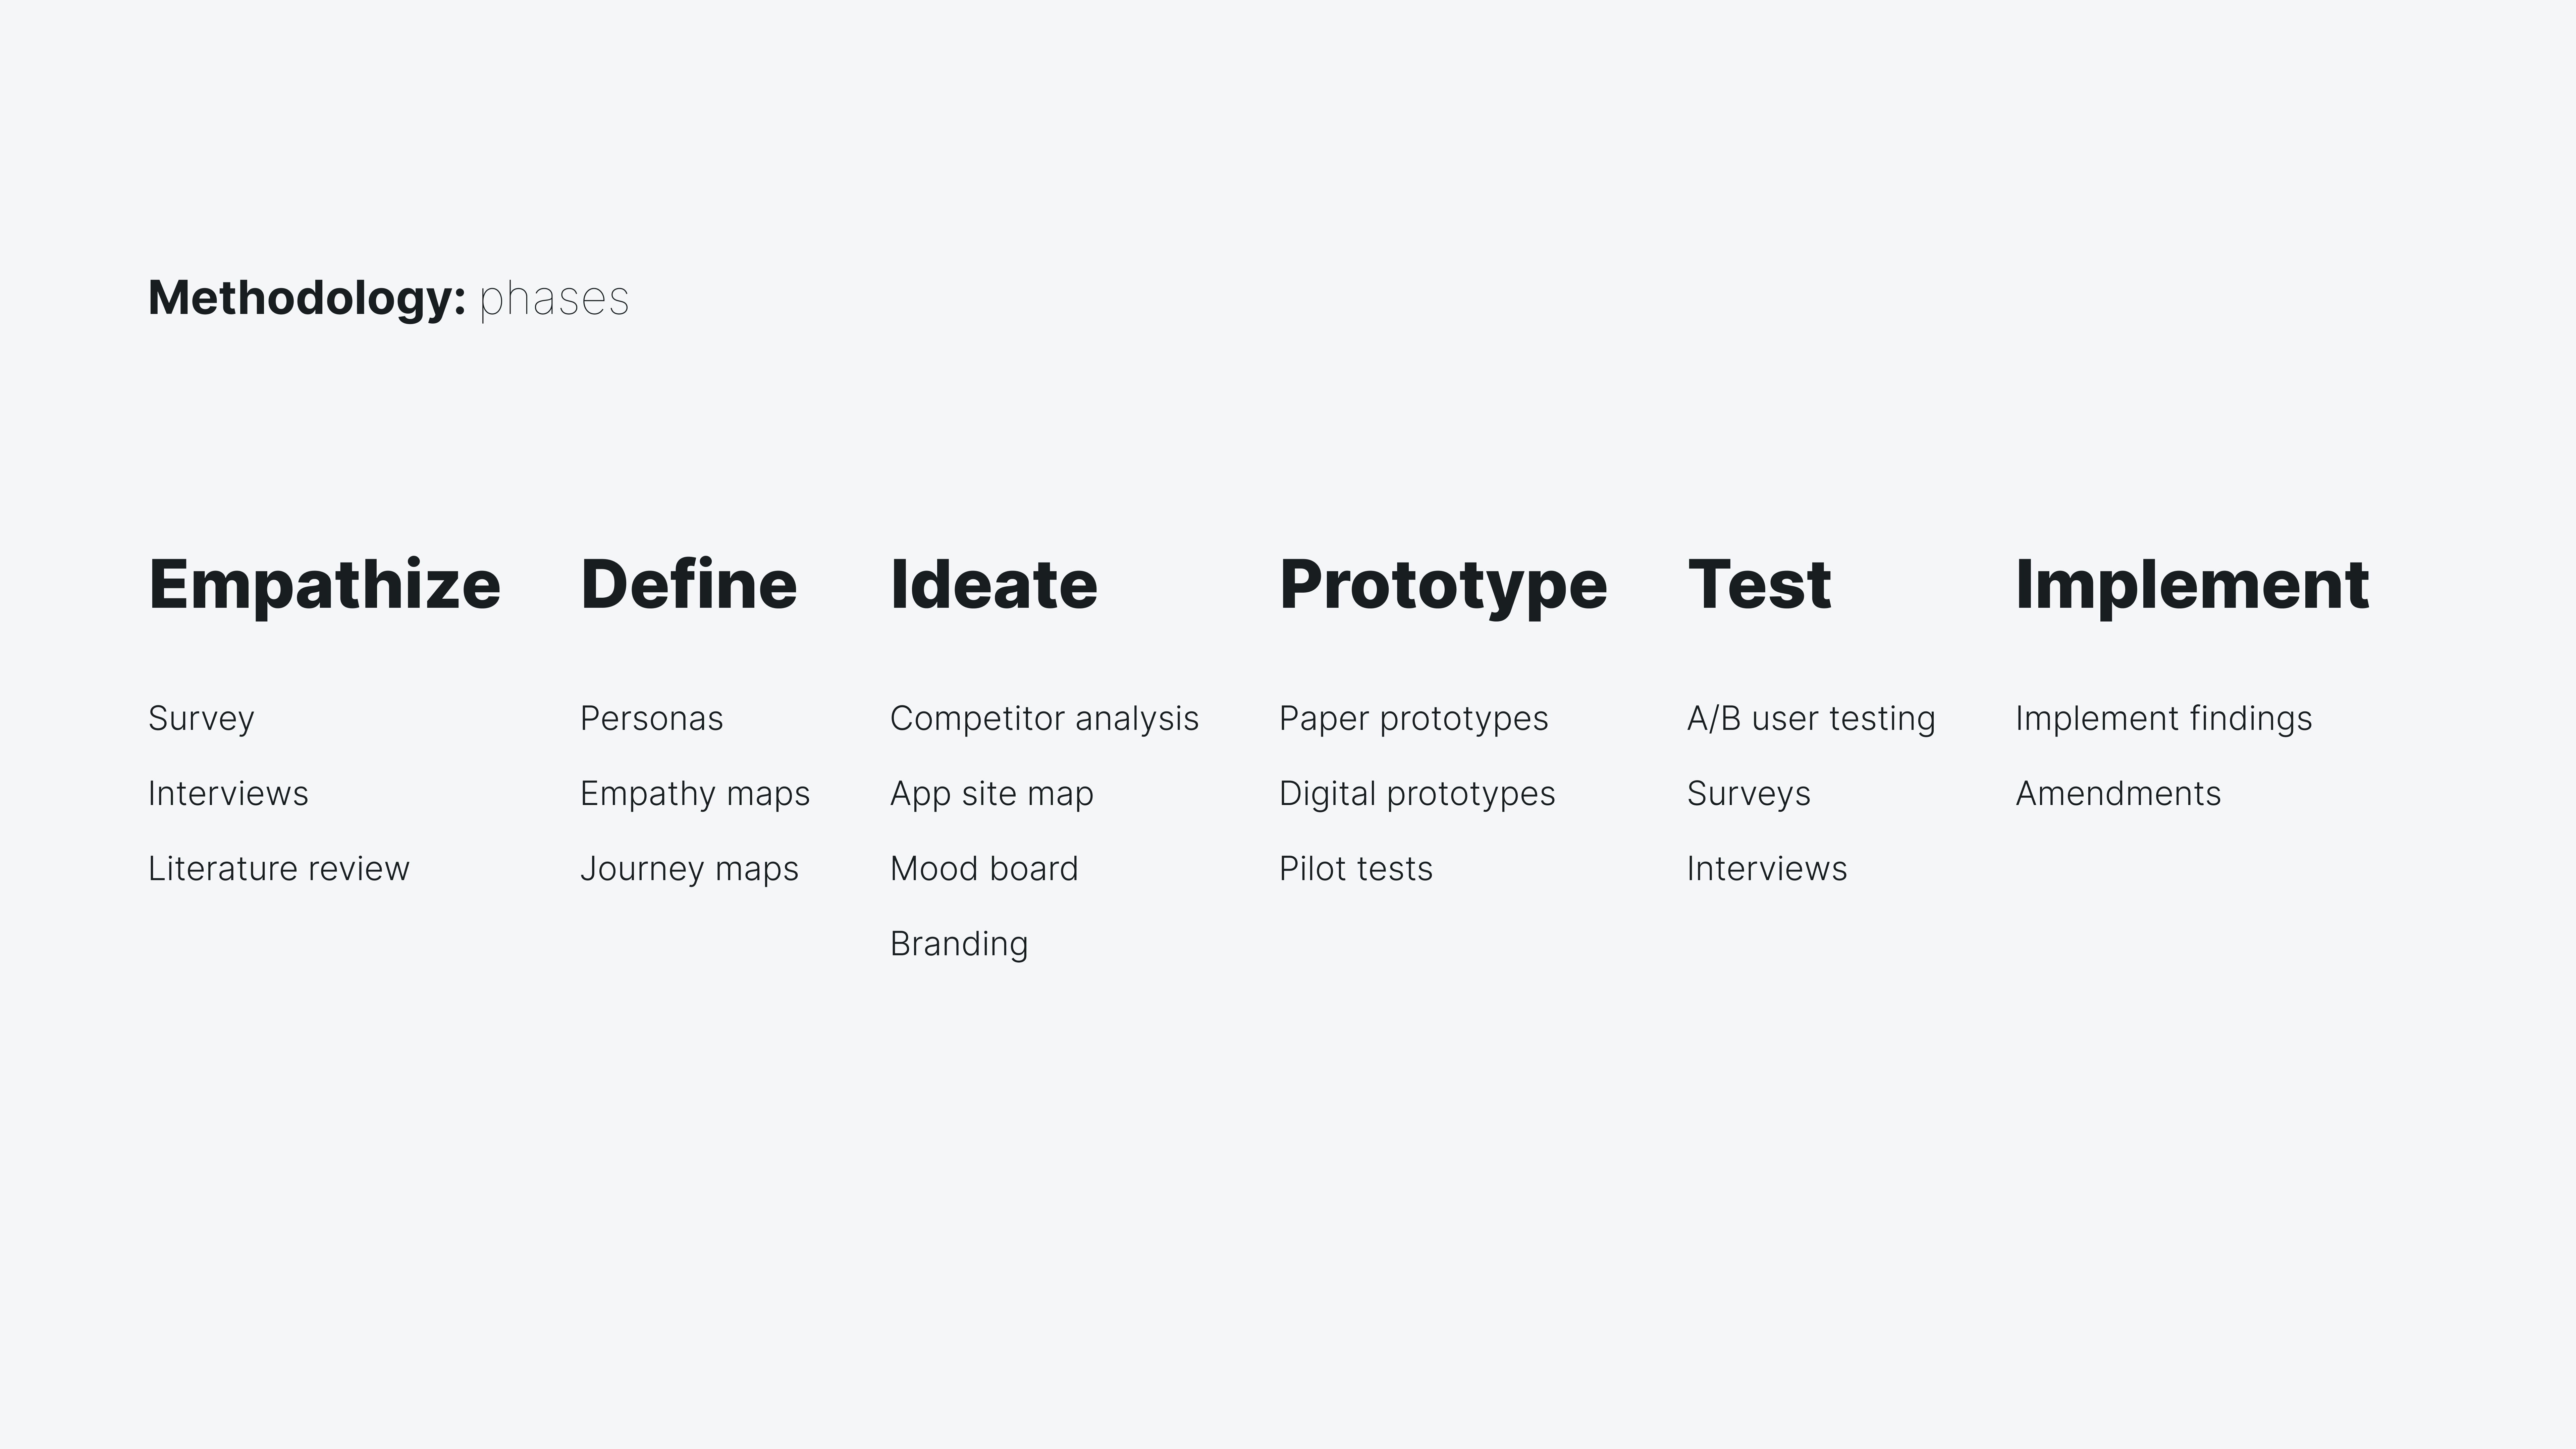
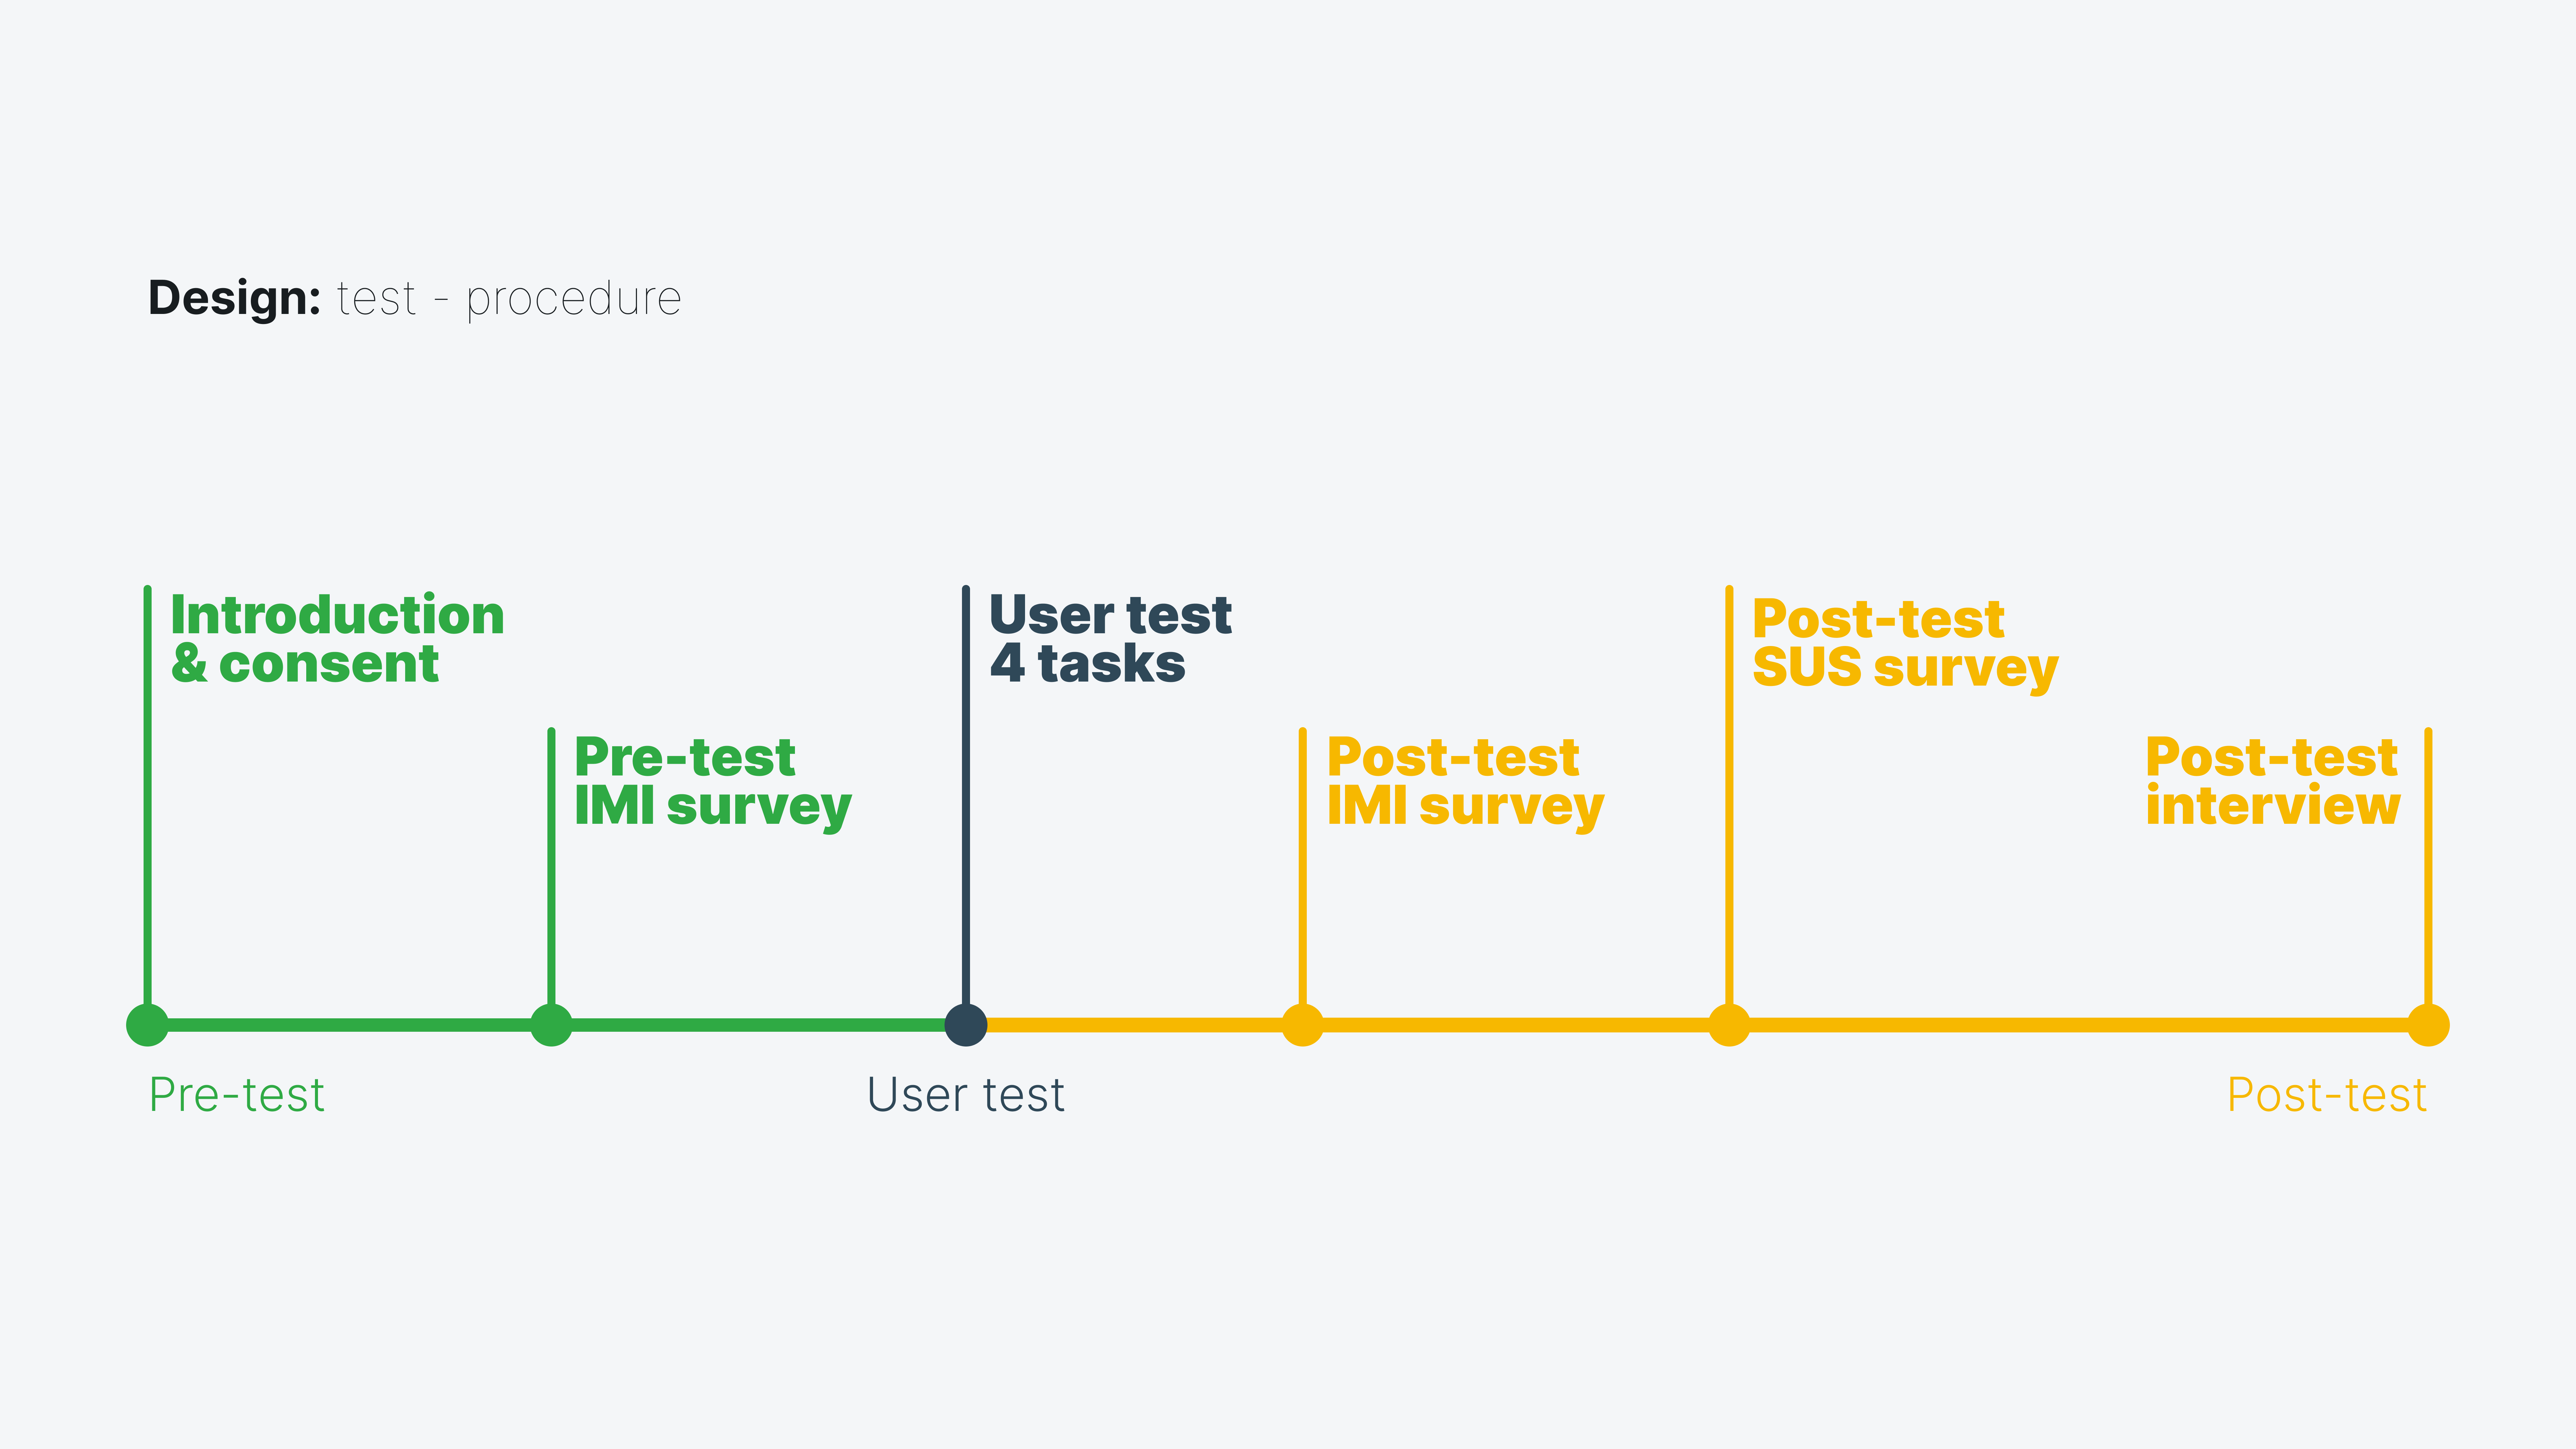
UN (2021) estimates that food waste contributes 8-10% of global greenhouse gas emissions, and households waste globally 569 million tonnes of food per year. This research project explored the possibilities offered by a food management app to reduce this waste. The study examined if incorporating gamification and digital nudges can enhance users' intrinsic motivation. The research took a mixed-methods user-centered design approach. Two versions of an app were created. Version A has gamification and digital nudges, while Version B has no such features. A between-group test with 30 participants was conducted. Each user got to interact with one version. IMI surveys and interviews were conducted to gather both quantitative and qualitative data.

Image describing the percentages of food that is wasted. 17% of total global food production is wasted. 11% is thrown away by households globally.
Percentage of produced food that goes to waste.
The image shows the design process for the project. It follows the design thinking methodology and mixed-methods approach. It is divided in 6 phases, Empathize, Define, Ideate, Porotype, Test, and Implement.
The design process follows the design thinking methodology and mixed-methods approach.
The image shows thematic analysis of finding of the interviews.
Thematic analysis of finding of the interviews.
The image shows information on the main persona, Sarah Green who is a young individual interested in cooking more sustainably.
The main persona, Sarah Green, is a young individual interested in cooking more sustainably.
The image shows the empathy map of Sarah Greene, the main persona. It provides information on what she sees, hears, thinks, and feels.
Sarah Greene's empathy map.
The image shows the user journey map of the main personal Sarah Greene. It provides insight on the steps she takes regarding her experience with cooking.
Sarah Greene's user journey map.
The image shows a competitor analysis between 3 competitors, Duolingo, Google Maps, and Forest app.
Competitor analysis between 3 apps, Duolingo, Google Maps, and Forest app.
The image shows a competitor visual analysis board specifically that of Duolingo. It contains notes on various visuals of the app.
Competitor visual analysis board of Duolingo.
The images shows the mood board used to shape the visual language of Savr. It consists of many visuals elements from various apps with a similar feeling.
Mood board used to shape the visual identity of Savr.
The image shows the branding of Savr. It has information on its name, slogan (more taste, less waste), the logo, tone of voice, brand colors, typography, iconography, and photography.
Savr brand.
This image shows the paper prototype with notes on it from feedback from the 3 user tests.
Paper prototype with notes on it with feedback from the 3 user tests.
This image shows some screens from both versions of the interactive digital prototype.
A few screens from both versions of the interactive digital prototype.
This image shows the process of the user testing done for the experiment. It is divided in 3 sections, Pre-test, user test, and post-test. Pre-test starts with introduction and consent, and then Pre-test IMI survey. The user test consists of the 4 tasks. Lastly Post-test starts with post-test IMI survey, post-test SUS survey, and the experiment end with the user interview.
The process of the user testing hosted for the needs of the experiment.
This image shows a screen form the Savr app with notes based on user feedback with possible beneficial amendments.
Notes with user feedback used to inform the amendments.
This image shows the SUS scores for both versions of the app. Version A scored 82.2 while version B scored 86.1.
SUS scores for both versions of the app.
This image shows the quantitative findings of the IMI surveys. It shows the IMI within-group changes. Both groups showed statistically significant improvements across all IMI subscales.  All p-values ≤ 0.05
IMI within-group changes.
This image shows the quantitative findings of the IMI surveys. It shows the IMI between-groups changes. No statistically significant differences were found between Prototype A and Prototype B on any IMI subscale. All p-values > 0.05
IMI between-groups changes.
This image shows thematic analysis done for the qualitative findings. The data were grouped in 4 groups based on the emerging patterns from the interviews and the user testing. These groups are usability, features, motivation, and pain points.
Thematic analysis done for the qualitative findings. The data were grouped in 4 groups based on the emerging patterns from the interviews and the user tests.
This image shows the key findings of the this study. Both app versions significantly improved users' intrinsic motivation to adopt more sustainable cooking habits. Both were usable but had information architecture shortcomings. Contrary to hypotheses H1 & H2 gamification and digital nudges did not result in a heightened increase in motivation. Reducing waste and saving money are inherently motivating. Gamification was not universally liked seen as unnecessary by many. Nudges were well perceived and liked.
Key findings of the study.
This image shows future research. Focus specifically on digital nudges. Larger and more diverse sample size. Longitudinal studies to see long-term impact on behavior and numbers on food waste reduction. Integration with smart appliances for automated inventory updates.
Future research.
Research Objectives

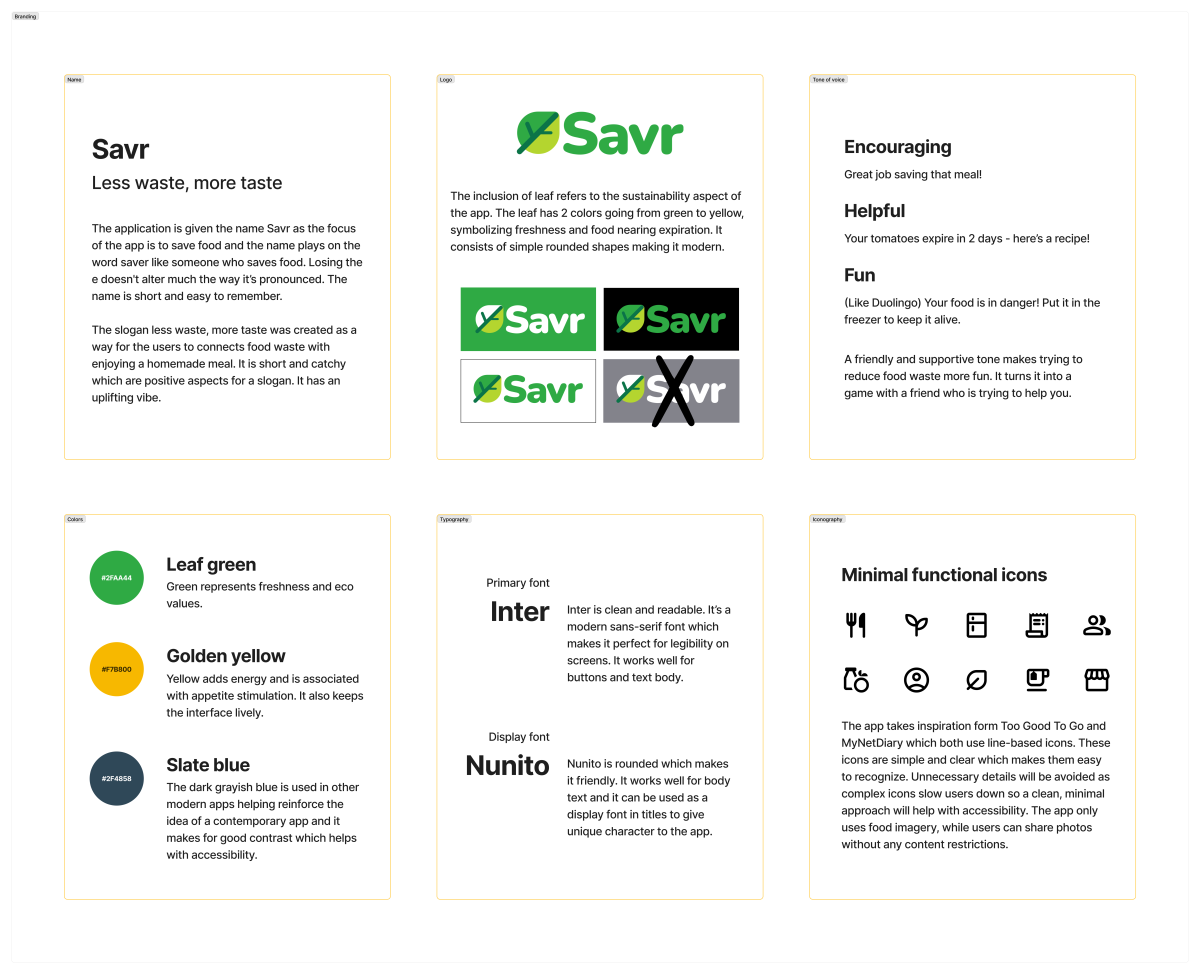
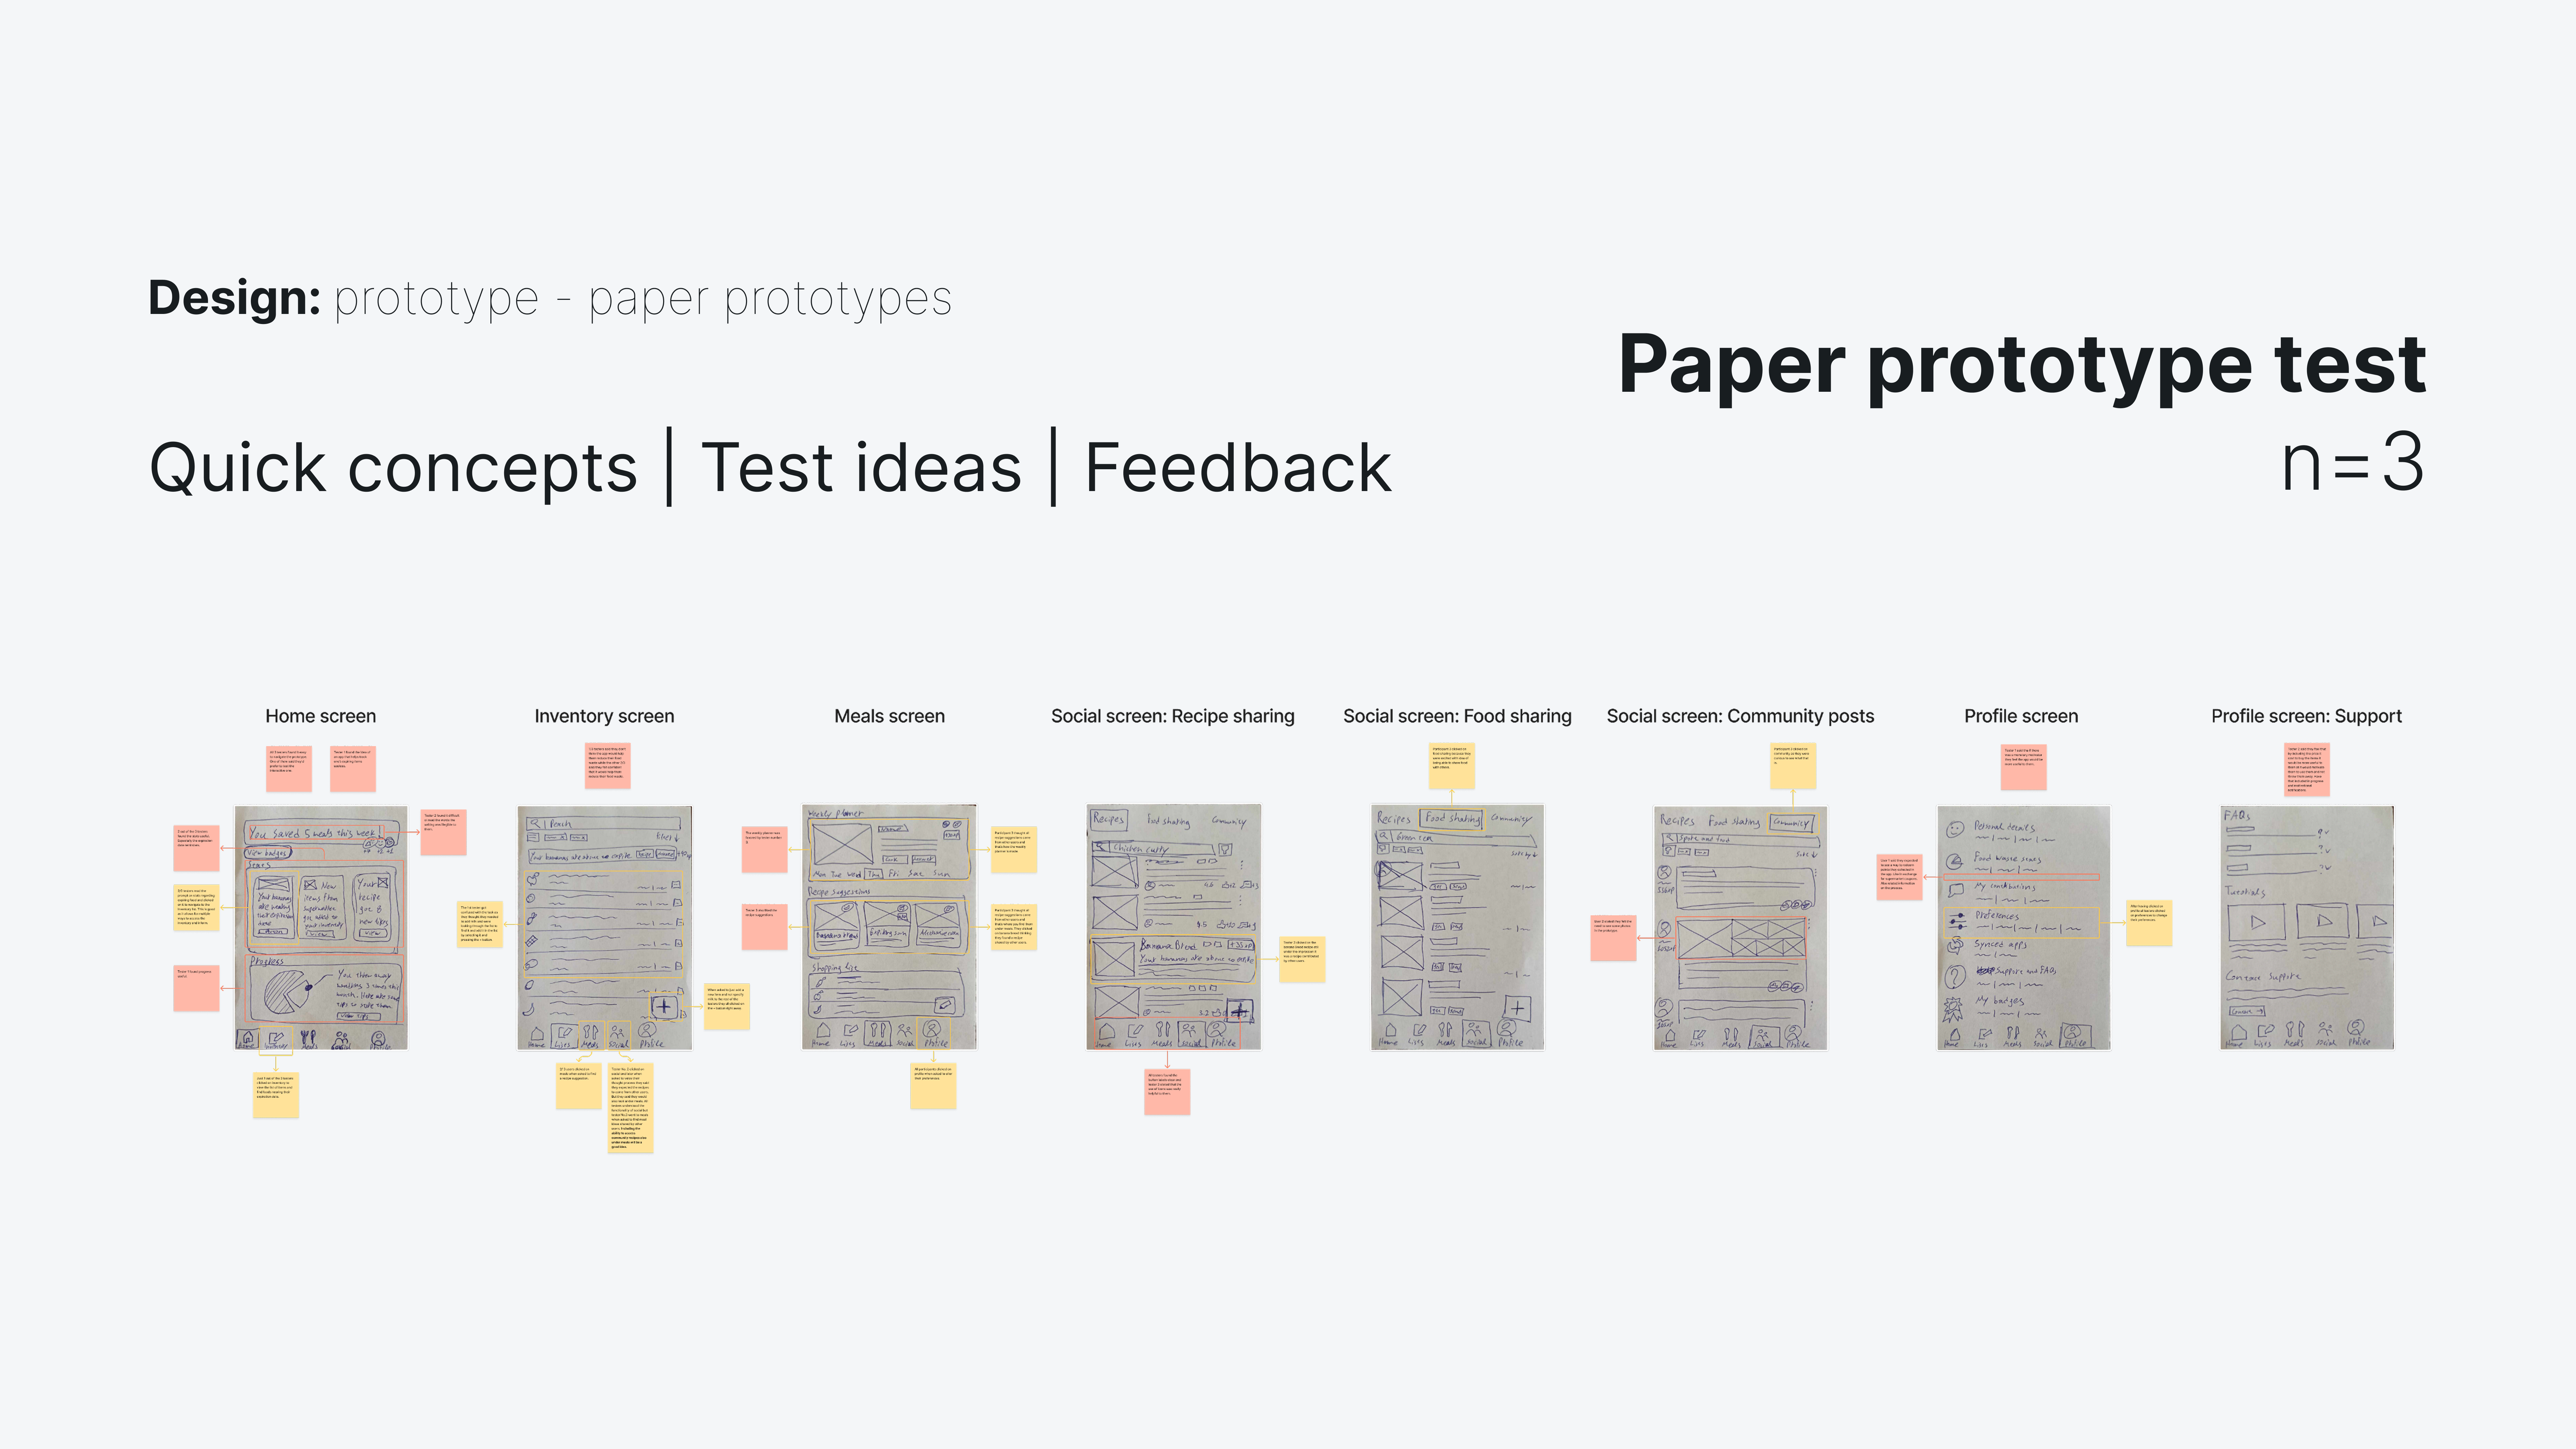
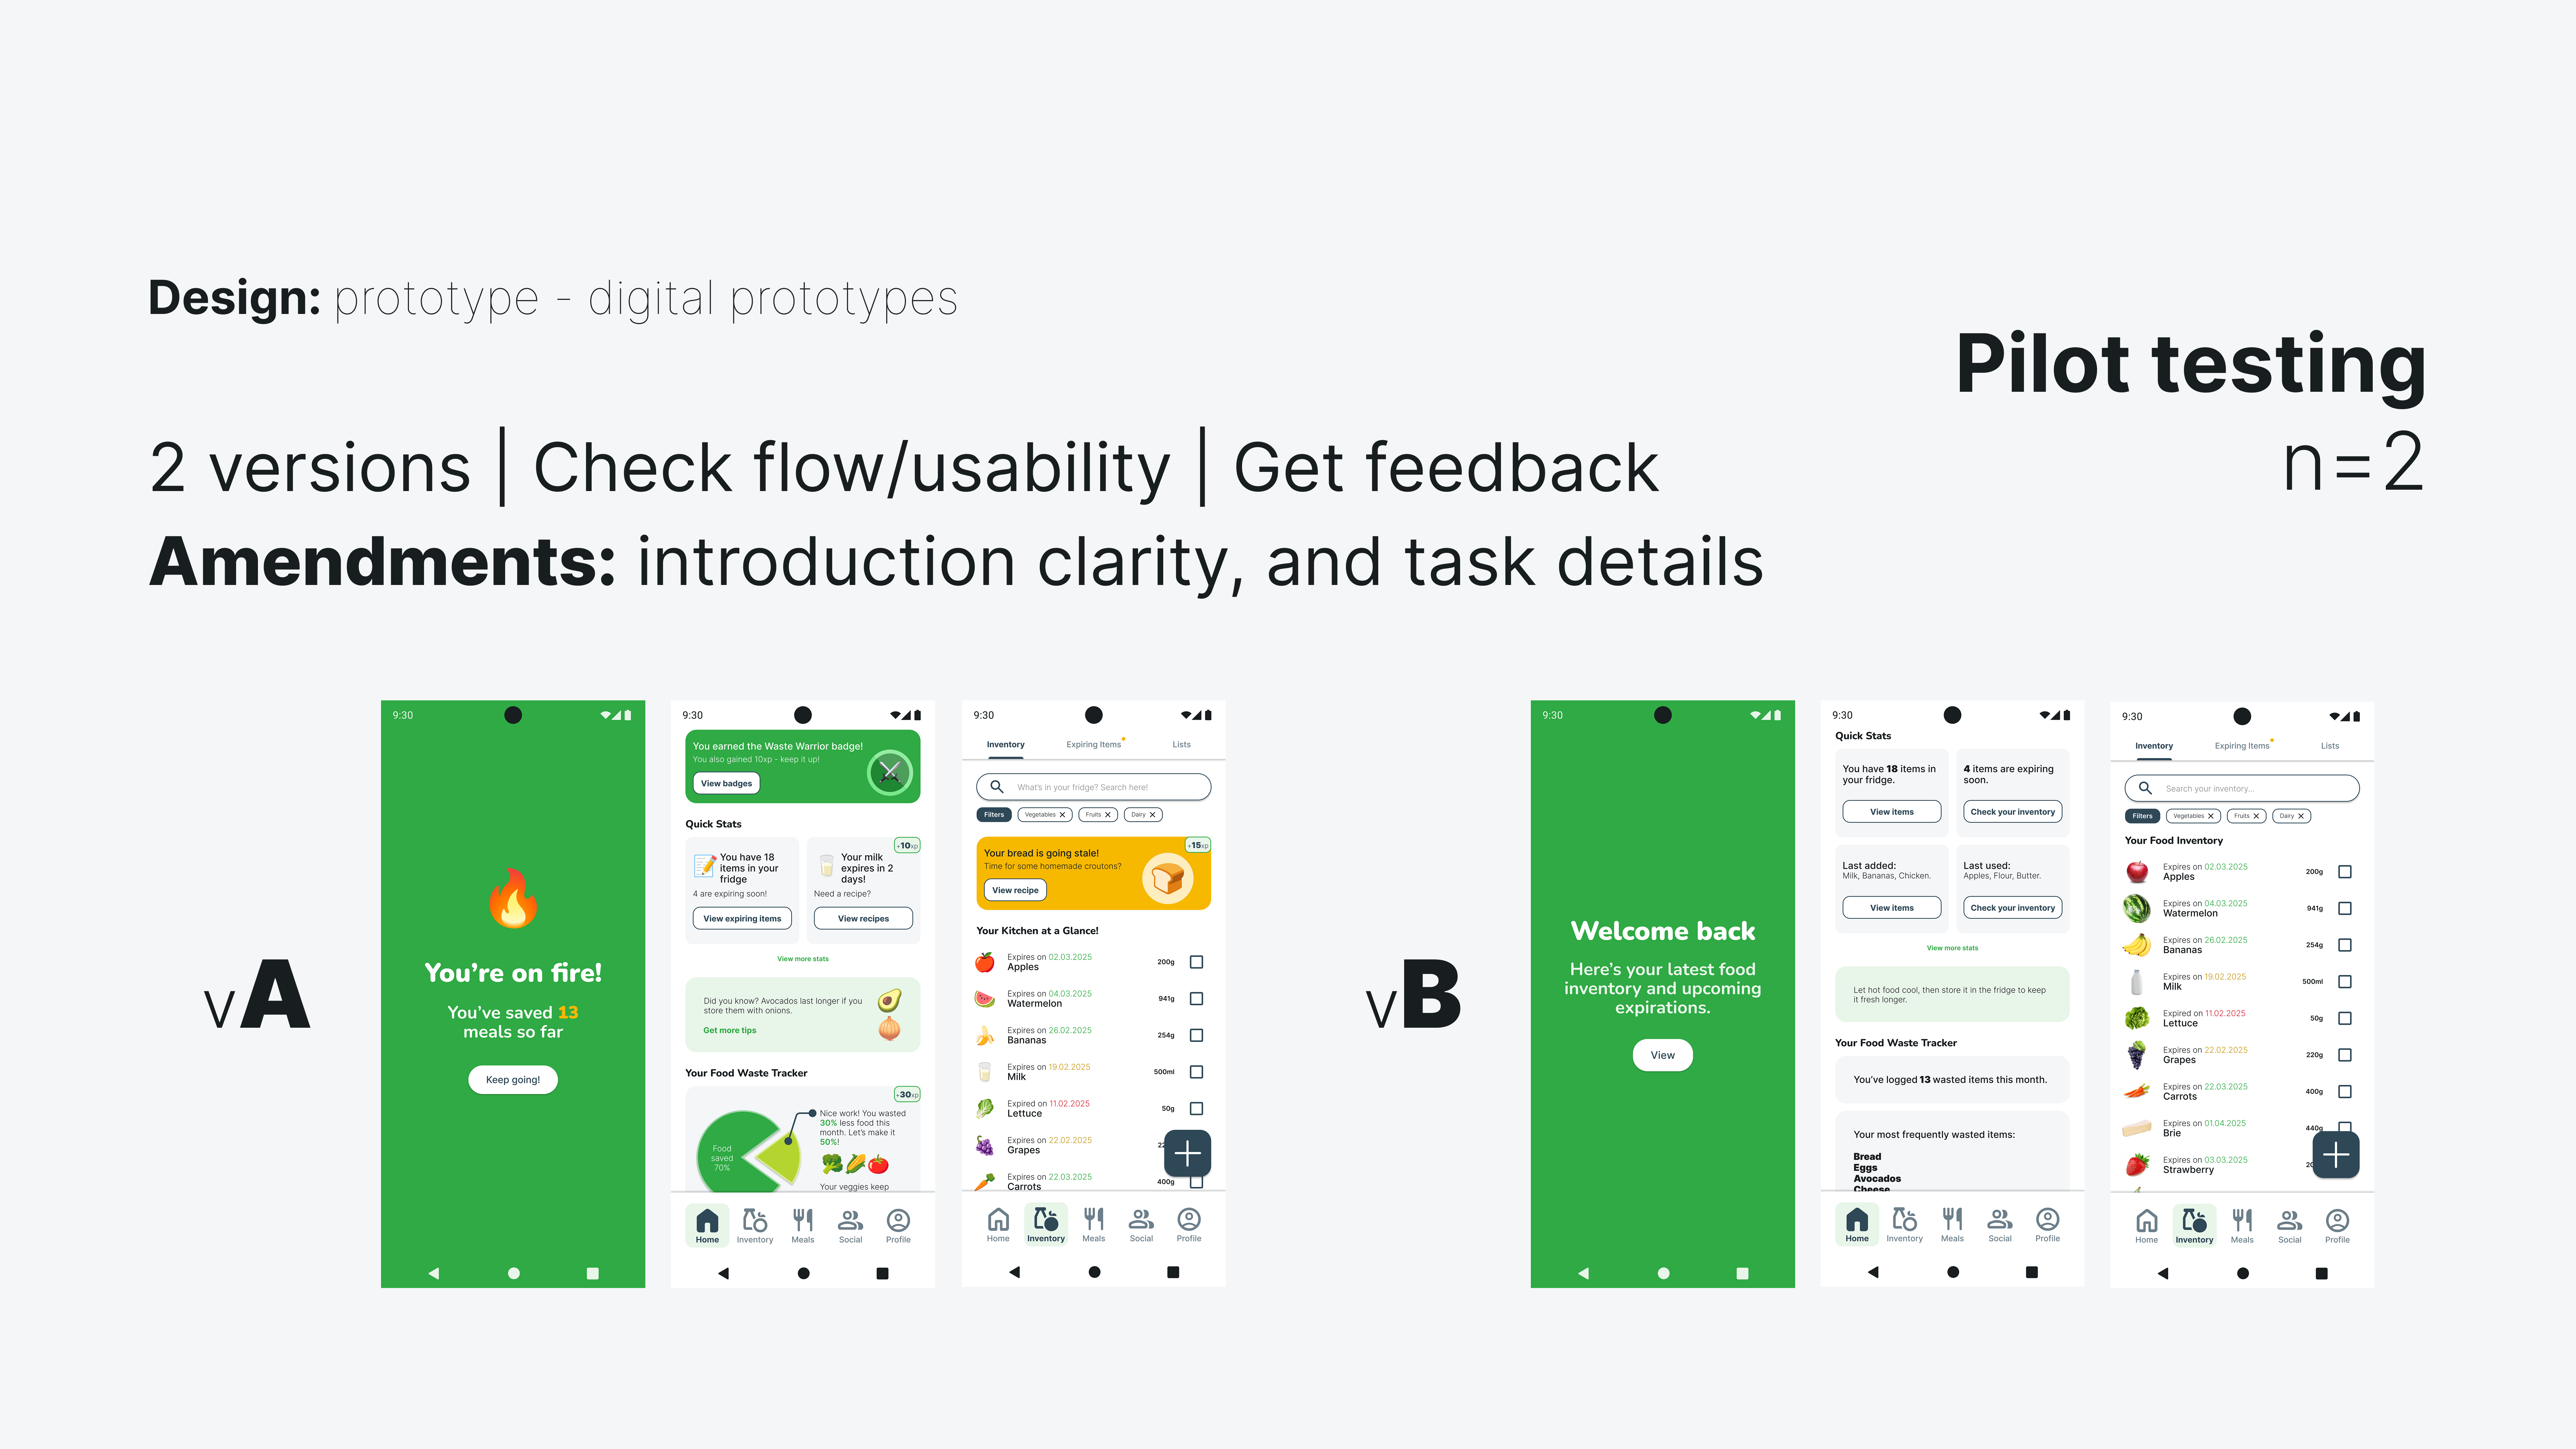
The goals for this research were to understand how much adding game-like elements to a food management app could actually motivate people to cut back on food waste by getting them into more sustainable cooking habits. The research also aimed to figure out how well digital nudges worked in getting users to actively use an app designed to help waste less food. A key part was also comparing the user motivation levels between app Version A, the one with the gamification and nudges, and Version B, which was the same but without those extra features. And finally, the research evaluated how easy and satisfying both of those app versions' designs were for users to work with.

Key Research Outcomes

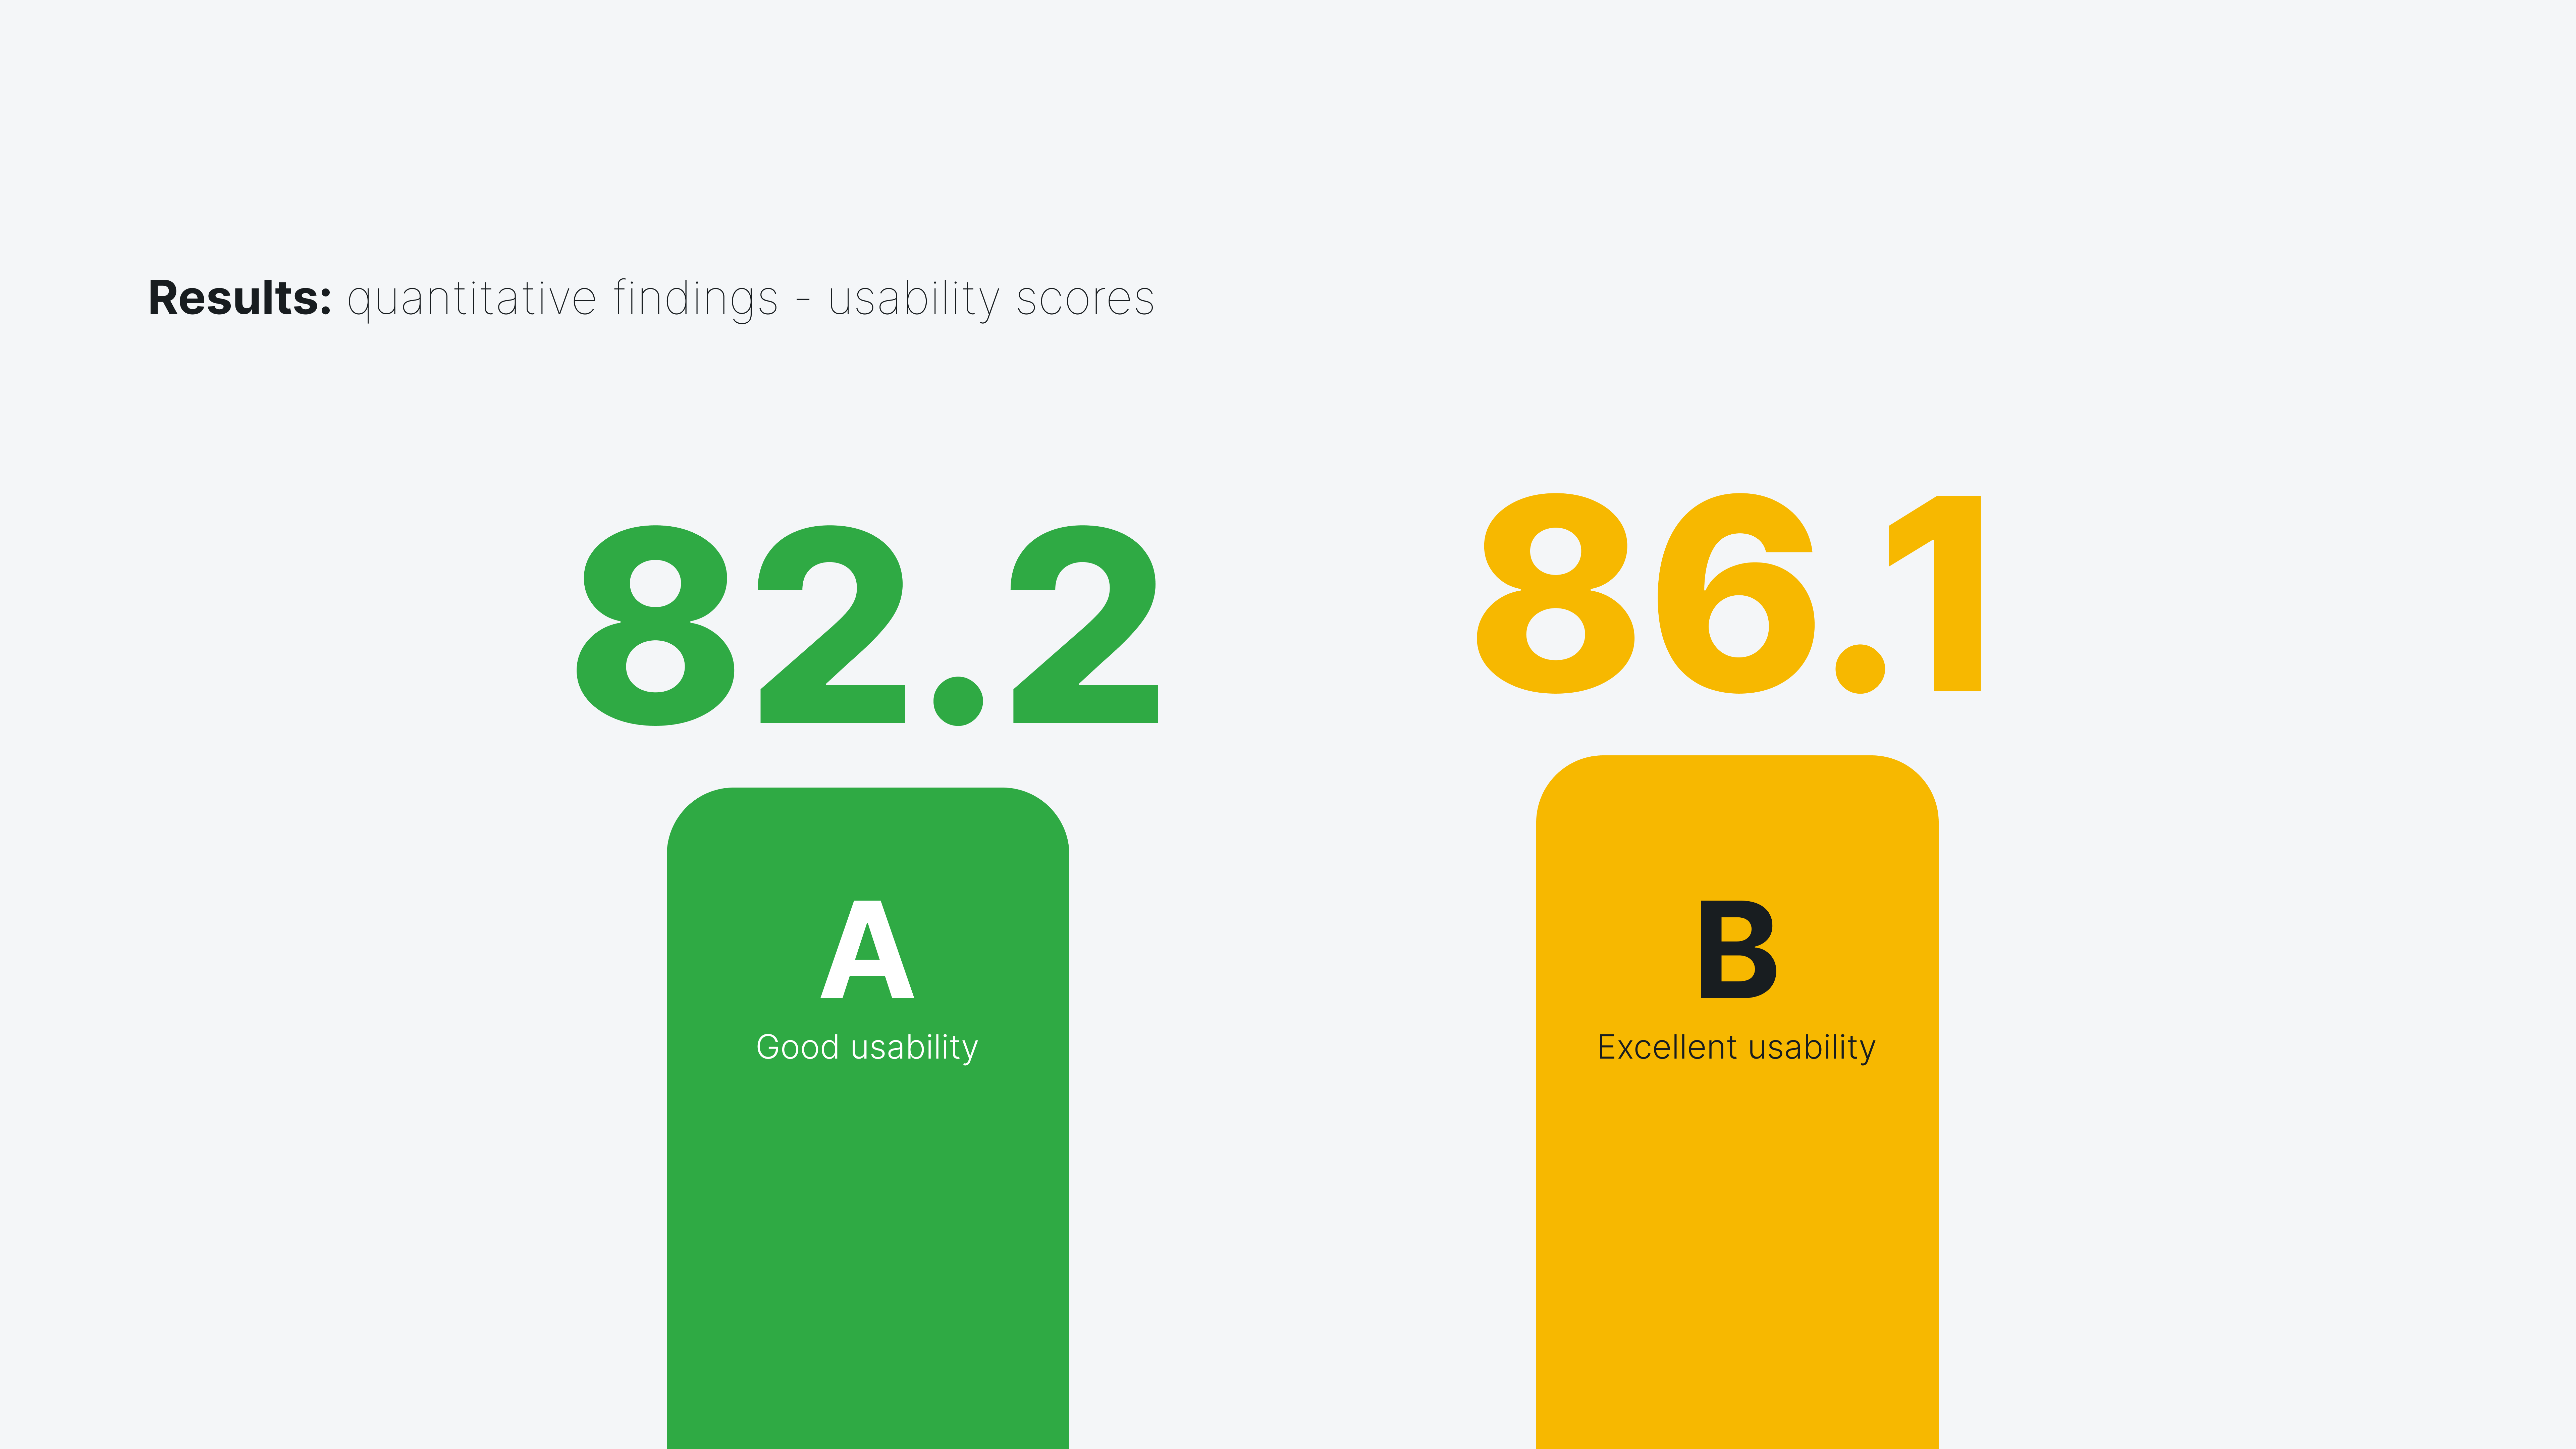
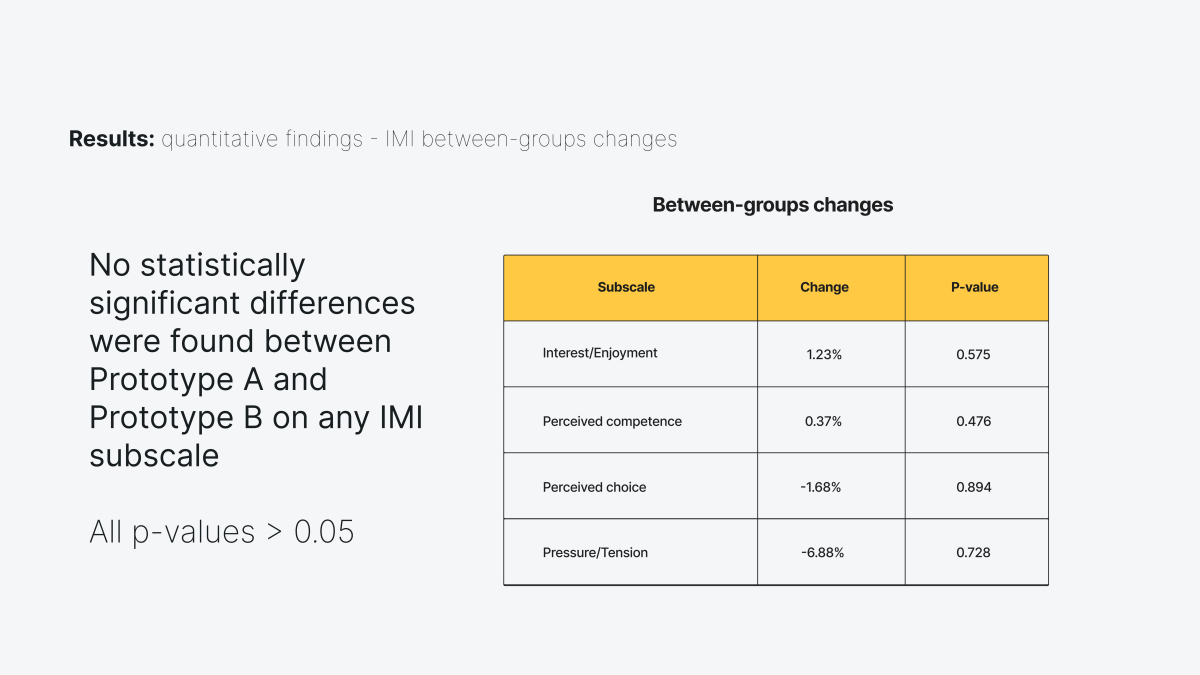
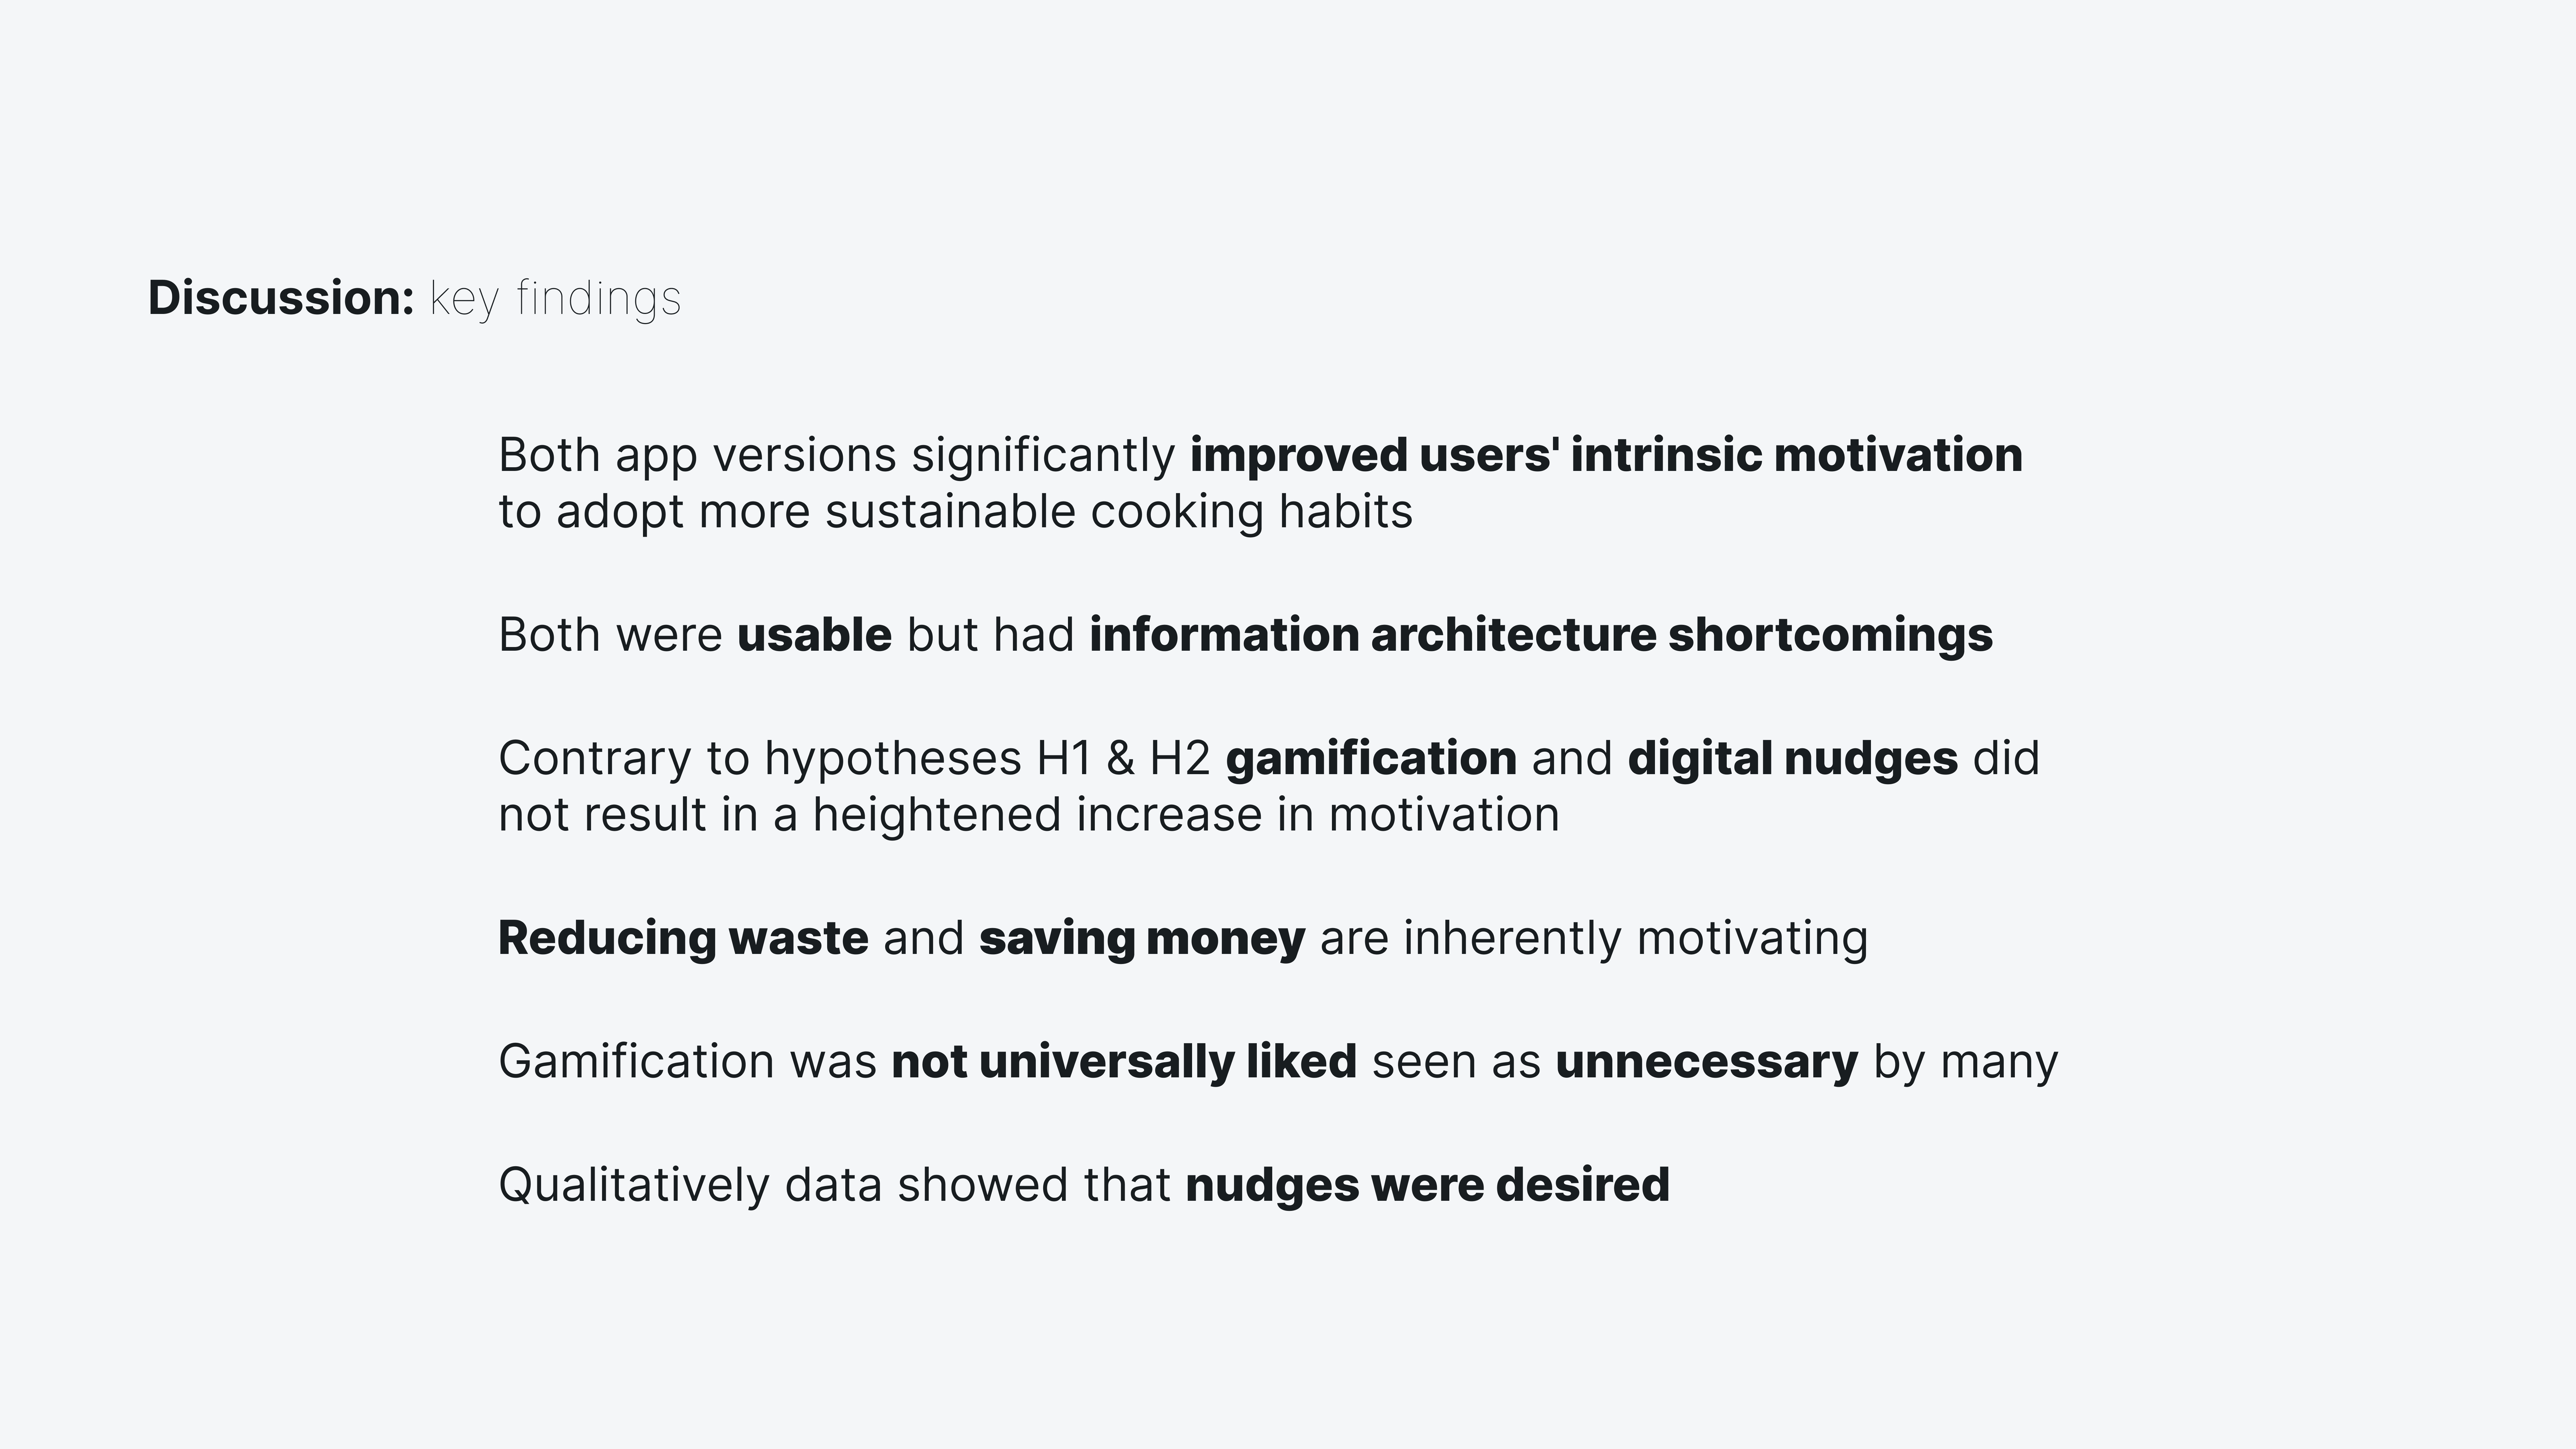
Both versions of the app boosted users' intrinsic motivation. There were improvements in all 4 IMI subscales compared to when they started. However, there wasn't a statistically significant difference in how much motivation improved between the 2 groups. This suggests that the core functionalities of food inventory management, recipe suggestions, and expiration tracking were strong motivators in themselves.

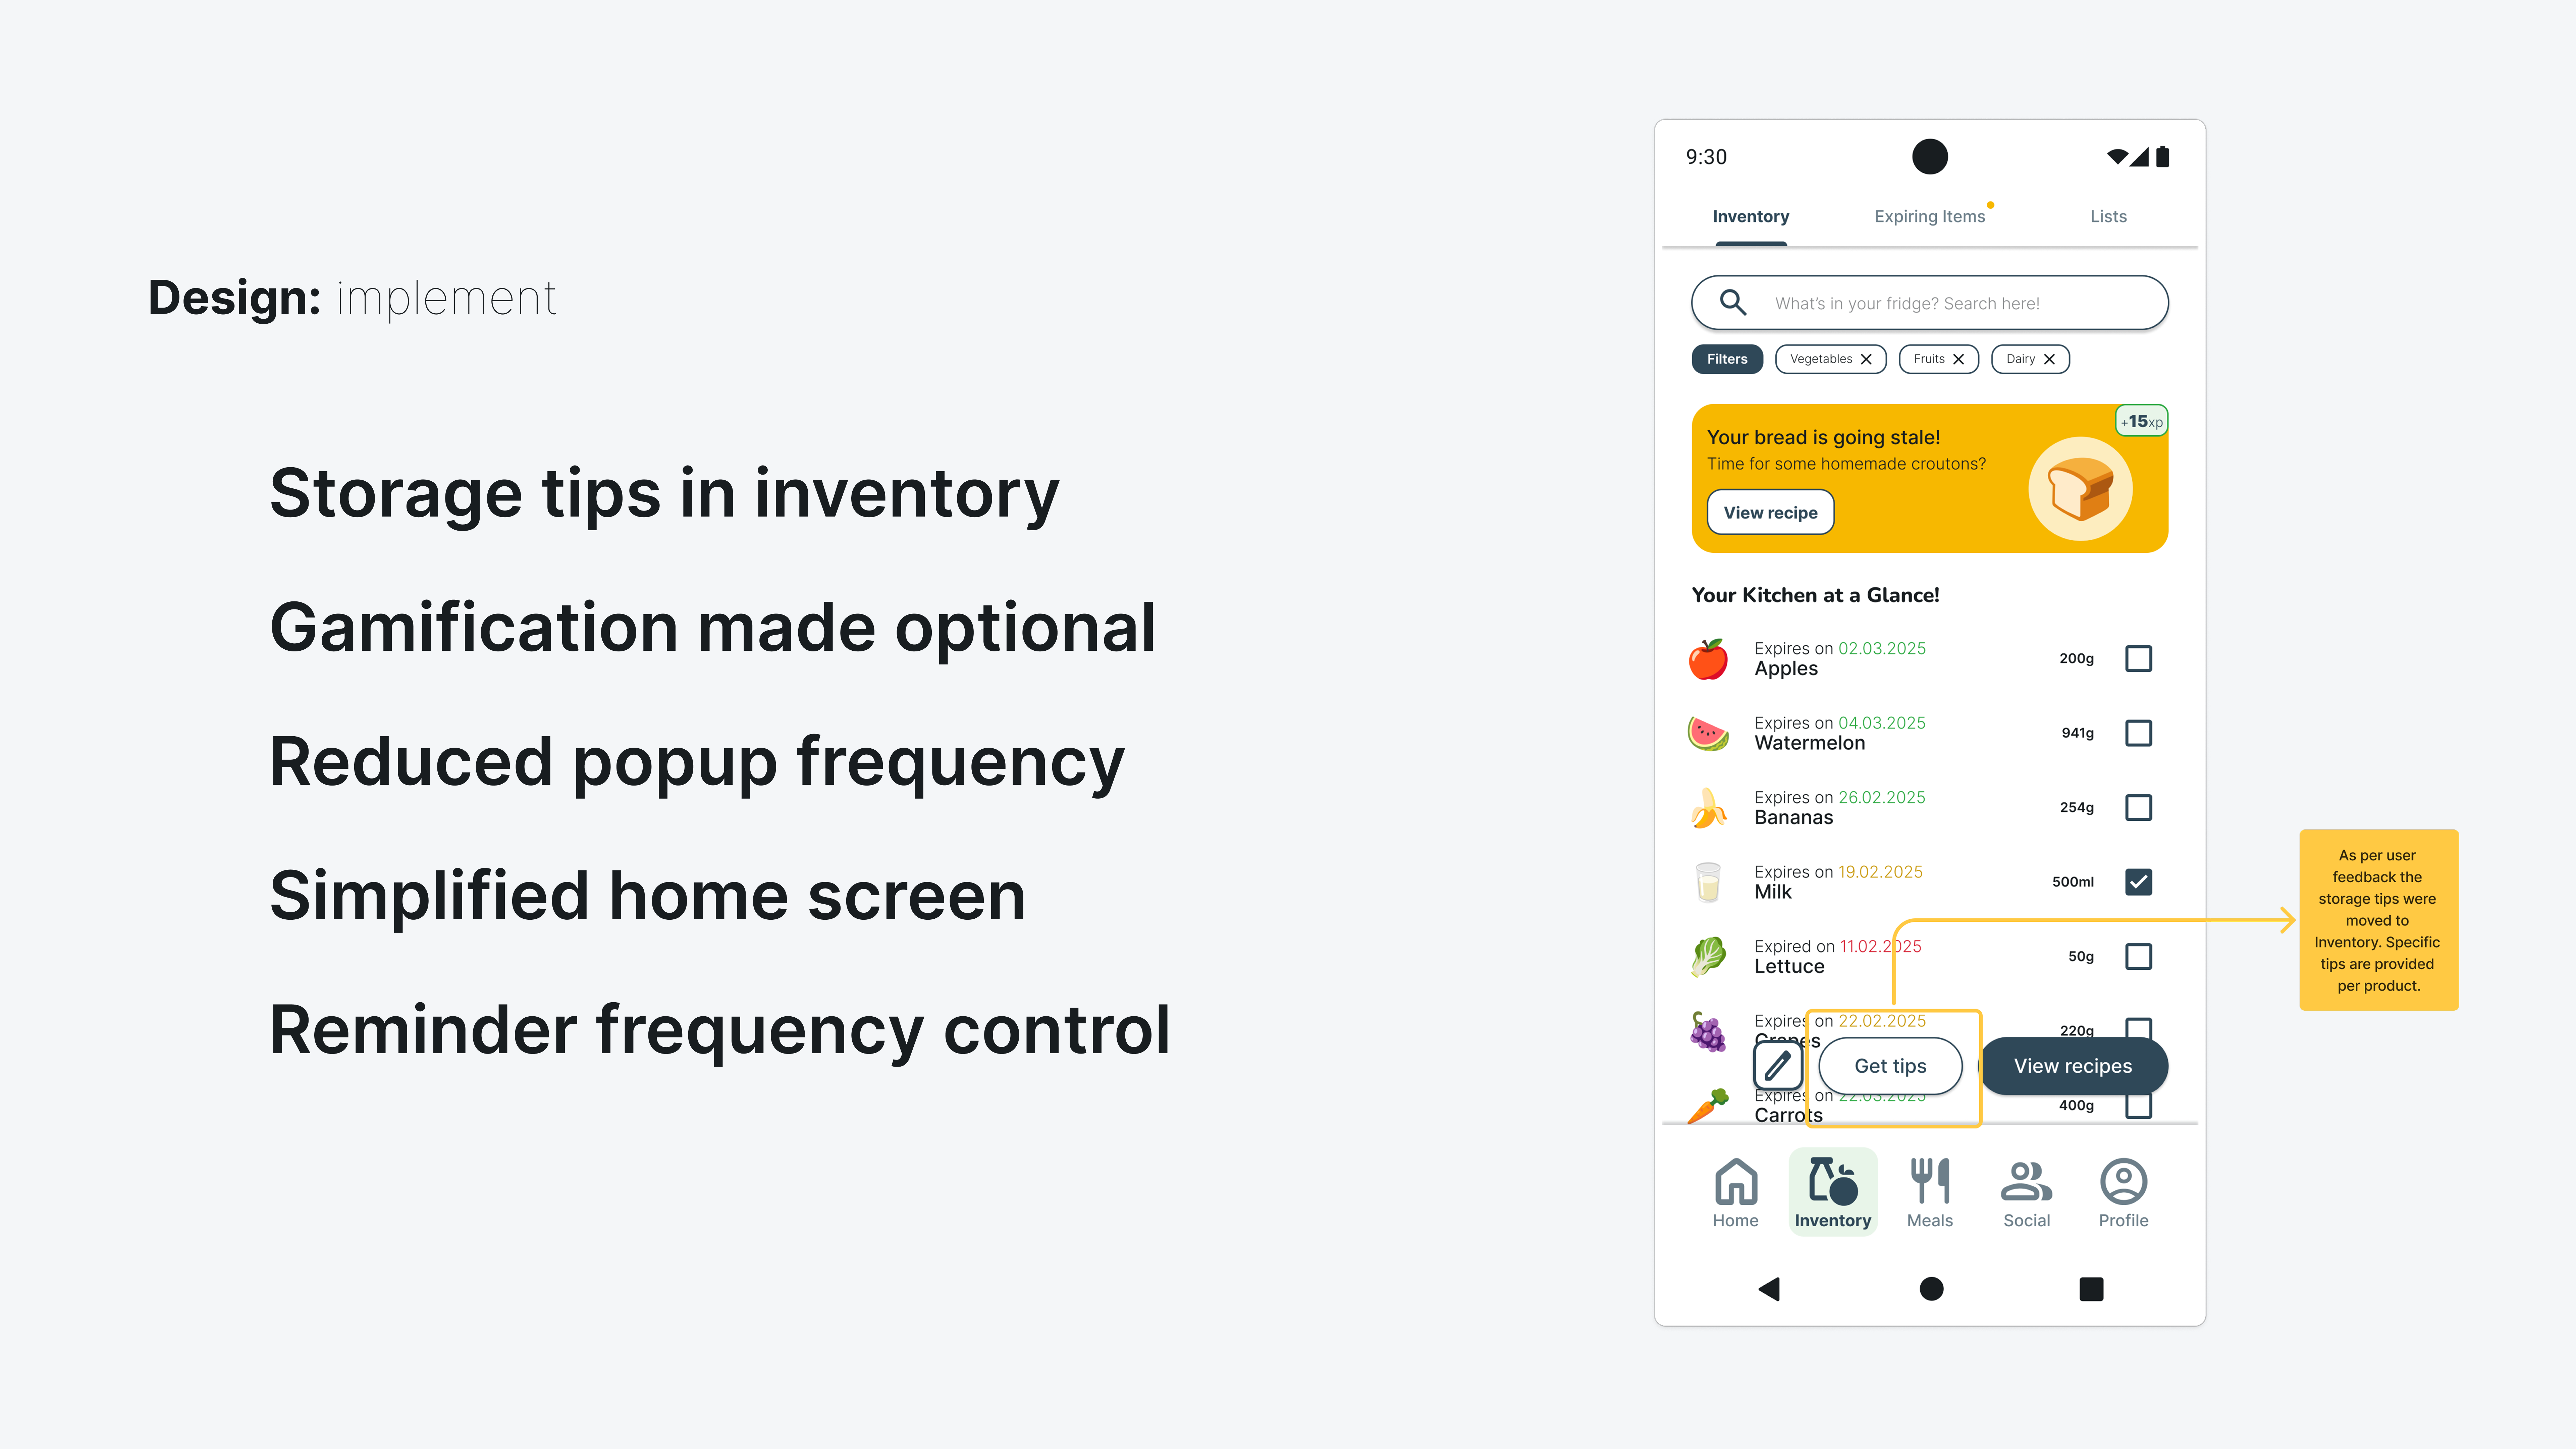
In terms of how easy the apps were to use, both versions did well. Version A got 82.2 on the SUS scale, while Version B scored a little higher at 86.1. However, the difference wasn't statistically significant.

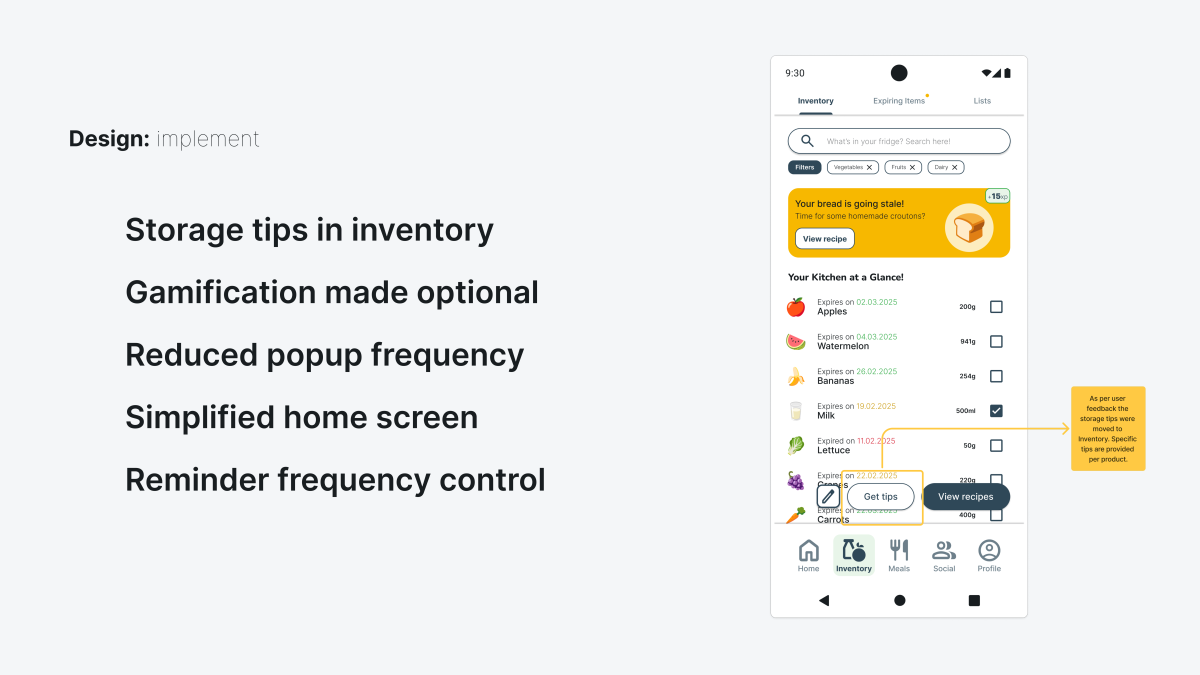
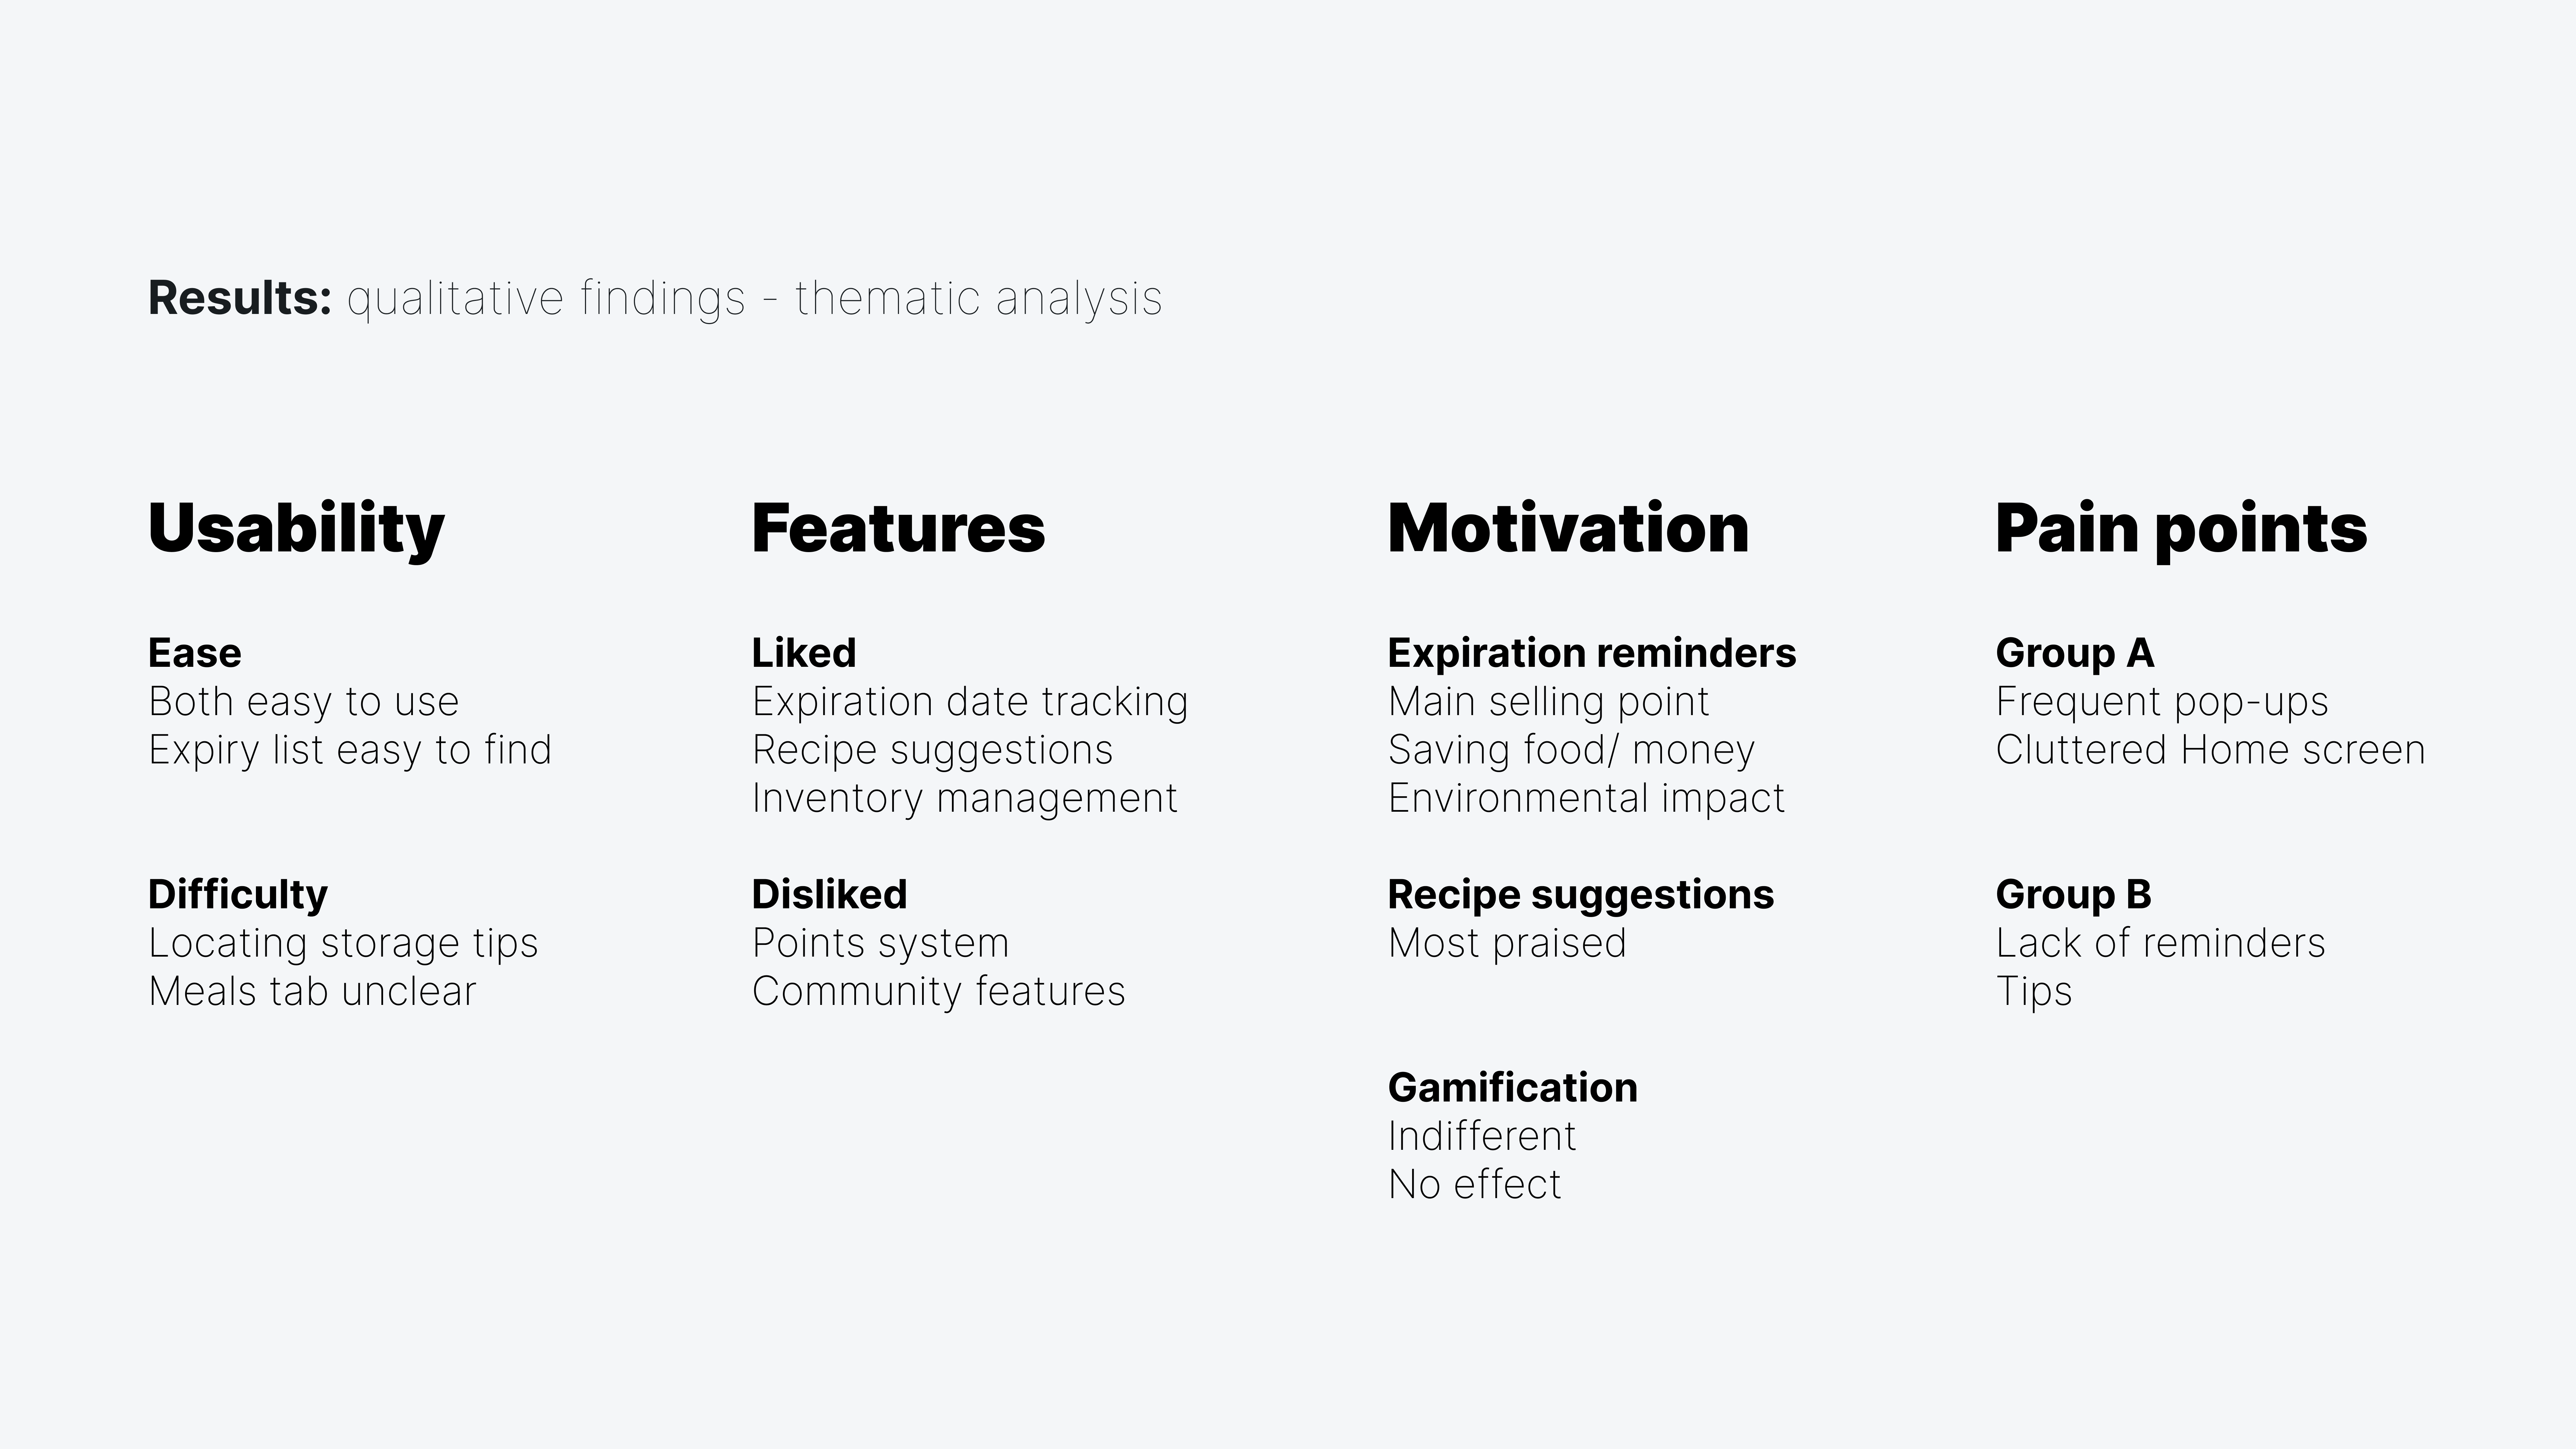
The user interviews offered plenty of insights. For instance, users really loved the core features, especially being able to track expiration dates and get recipe ideas using ingredients they already had. Digital nudges were generally seen as helpful and something users wanted. However, gamification got a mixed reaction. Some users enjoyed the game elements, but a good number felt they weren't really needed for this kind of app. They pointed out that saving money and reducing waste was already motivating enough.

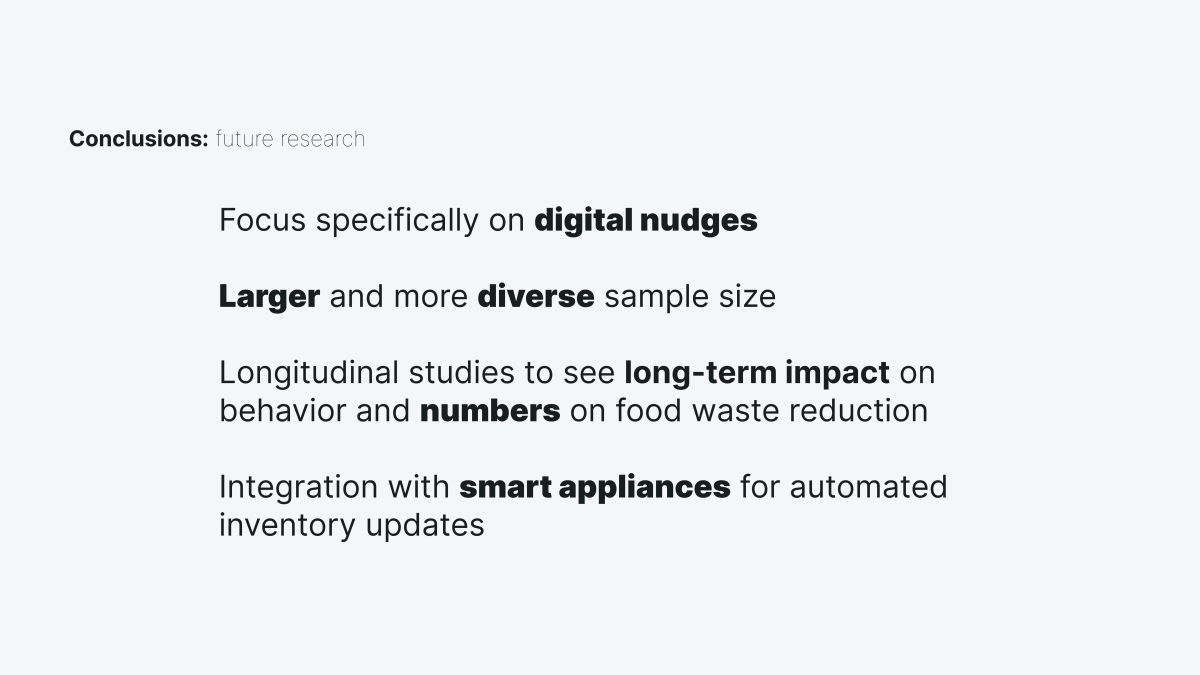
The findings suggest that while technology can definitely help people waste less food, the main focus should probably be on building solid core features. When adding gamification or nudges in this context, it's best to keep user preferences in mind. Including options for users to opt-out or control how often they get notifications would be beneficial.

Thesis: An evaluation of the impact of gamification and digital nudges on household food waste reduction

This thesis set out to investigate if a mobile food management app with gamification and digital nudges could motivate users to cut down on household food waste more than just a standard app. A mixed-methods study was conducted with 30 participants, using two different app versions, one that included gamification and nudges, and one that didn't. It found that both versions of the app significantly boosted users' intrinsic motivation for cooking more sustainably. However, adding gamification and nudges didn't result in a statistically significant improvement in motivation. Core functionalities, like tracking food inventory and getting recipe ideas, were already strong motivators. Qualitative data highlighted that users generally liked the idea of helpful nudges, especially reminders, but their feelings about gamification in this kind of app were mixed.

Profile image in black and white of Kostandinos Hodaj
Kostandinos Hodaj
MSc User Experience Design

Hi, I'm Kostandinos Hodaj, a creative and detail-oriented UX designer with a background in visual communication. My academic and professional experiences designing digital products and collaborating with diverse stakeholders have developed my understanding of user research and design thinking principles on a proficient level. For me, design is making things work for people. It's all about creative ideas, communicating concepts with visuals, empathizing with users' needs, and solving real problems. Food waste is one such real enviromental issue. To help expand on the ways to combat food waste, my research project focused on evaluating the impact of gamification and digital nudges on household food waste reduction.