Marlon Carney Crowe
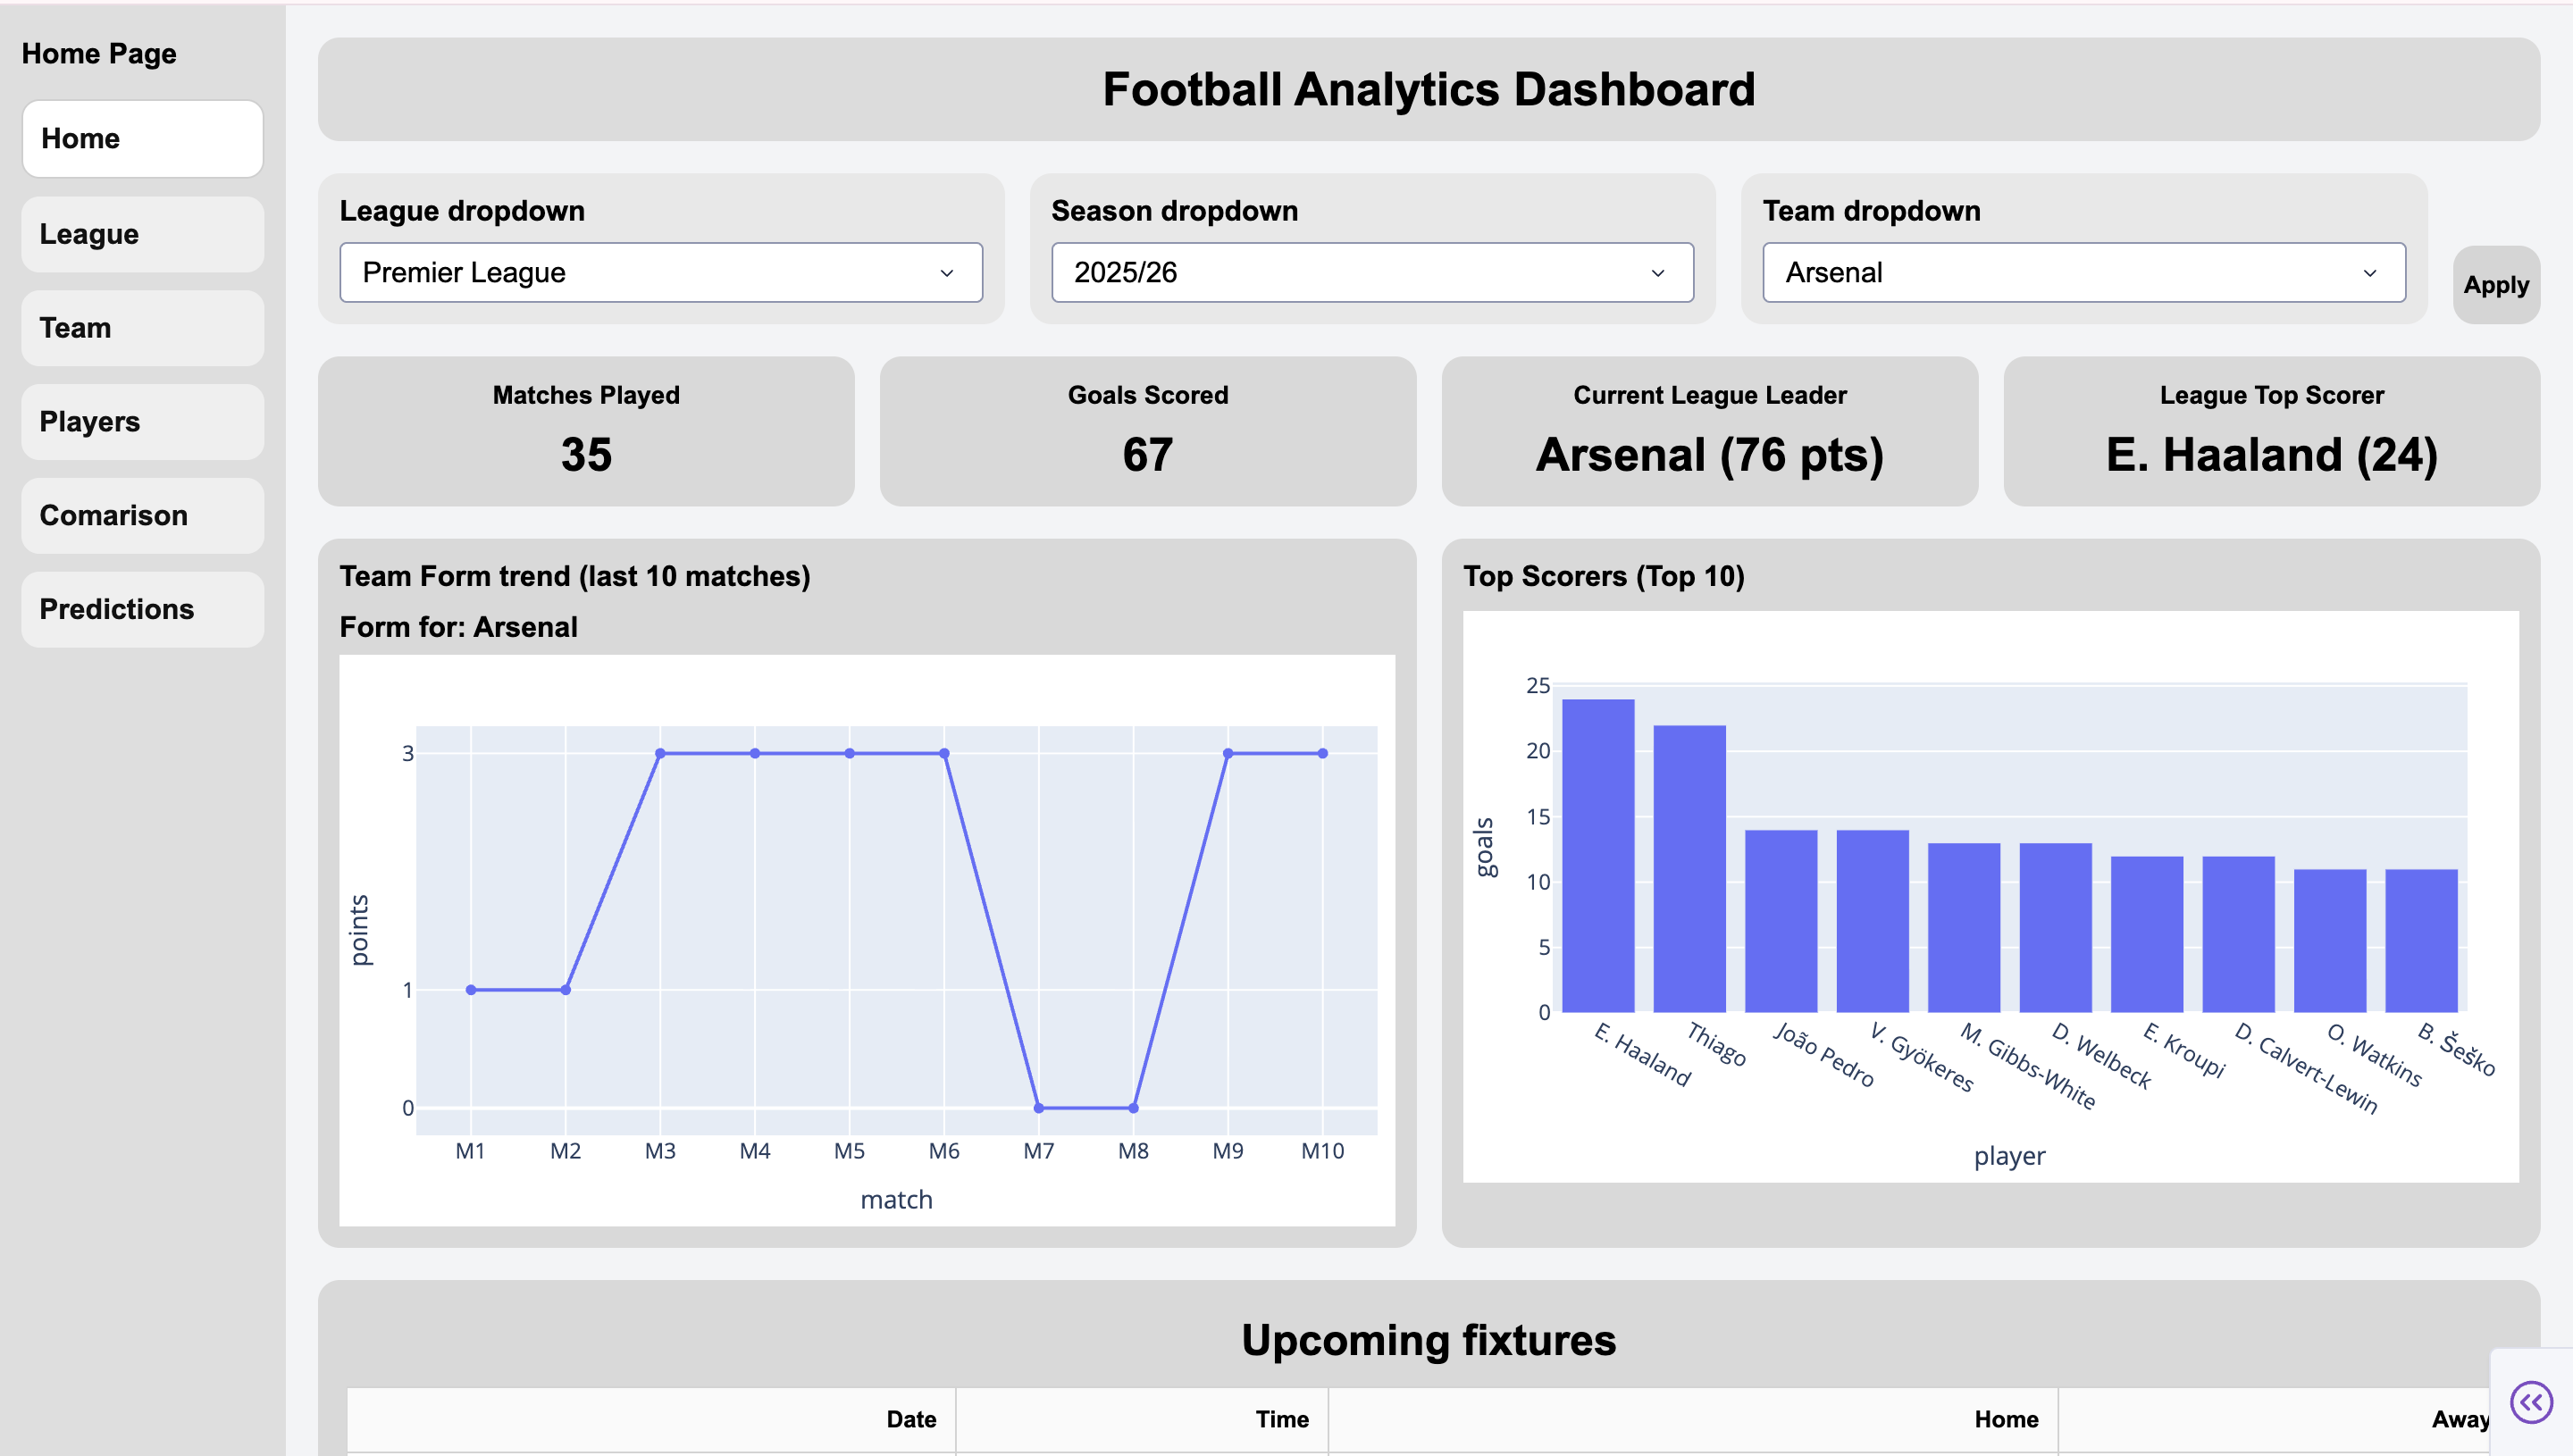
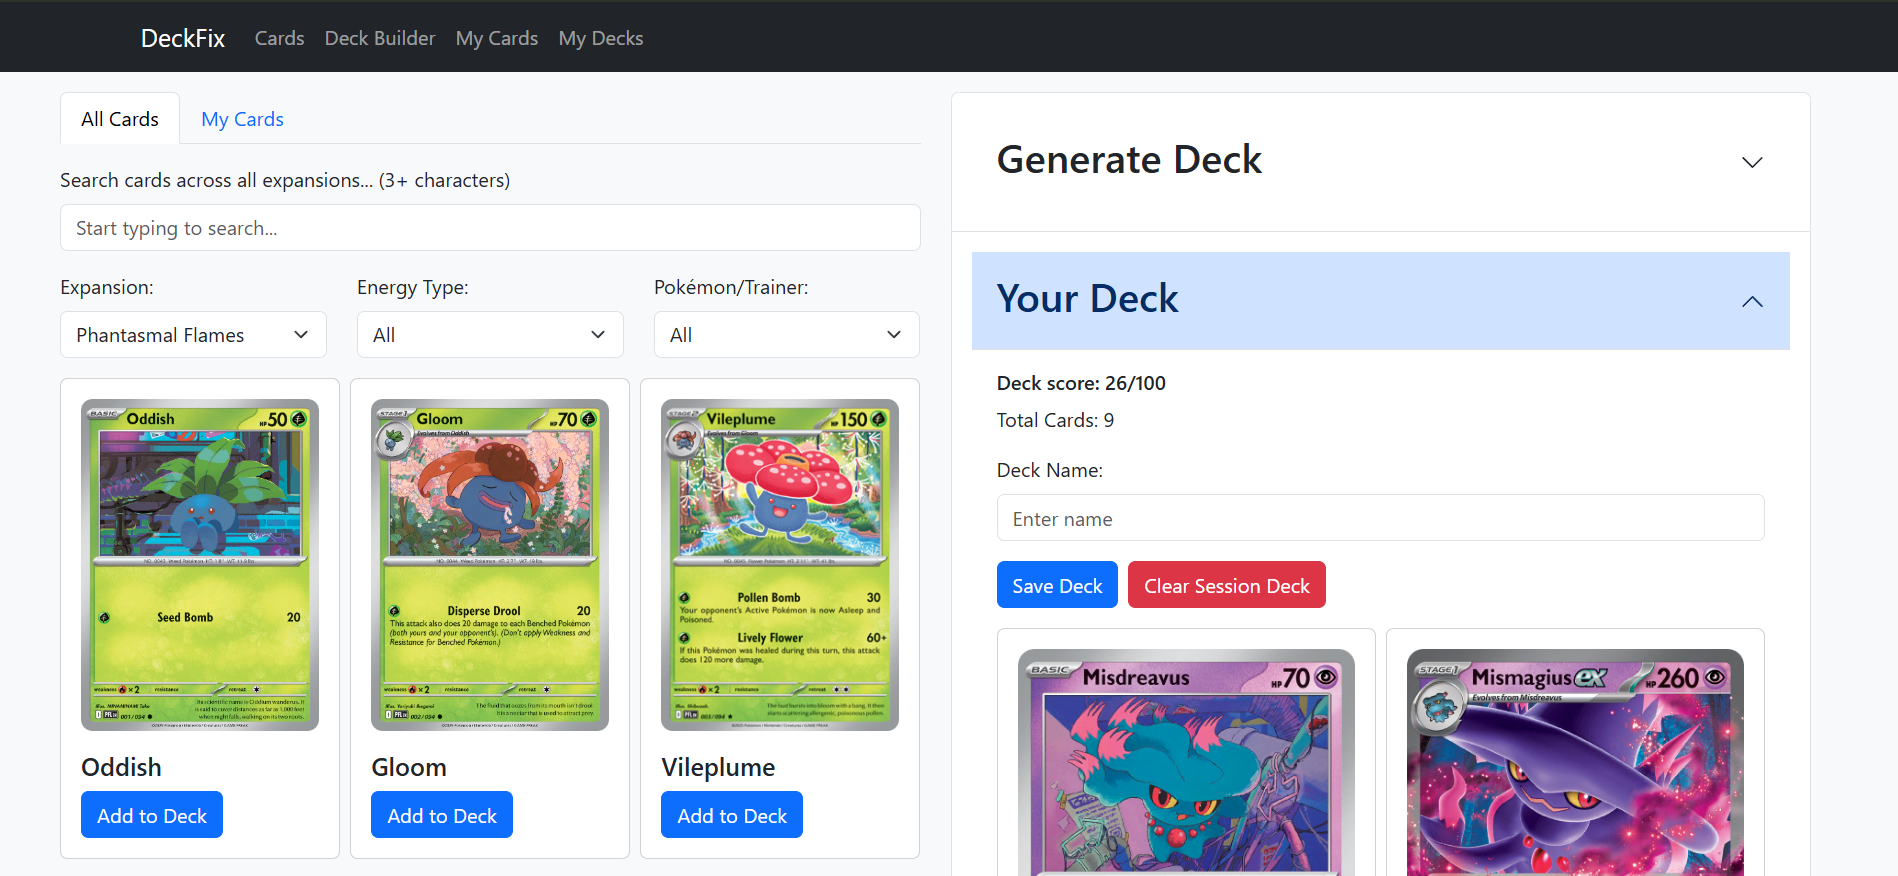
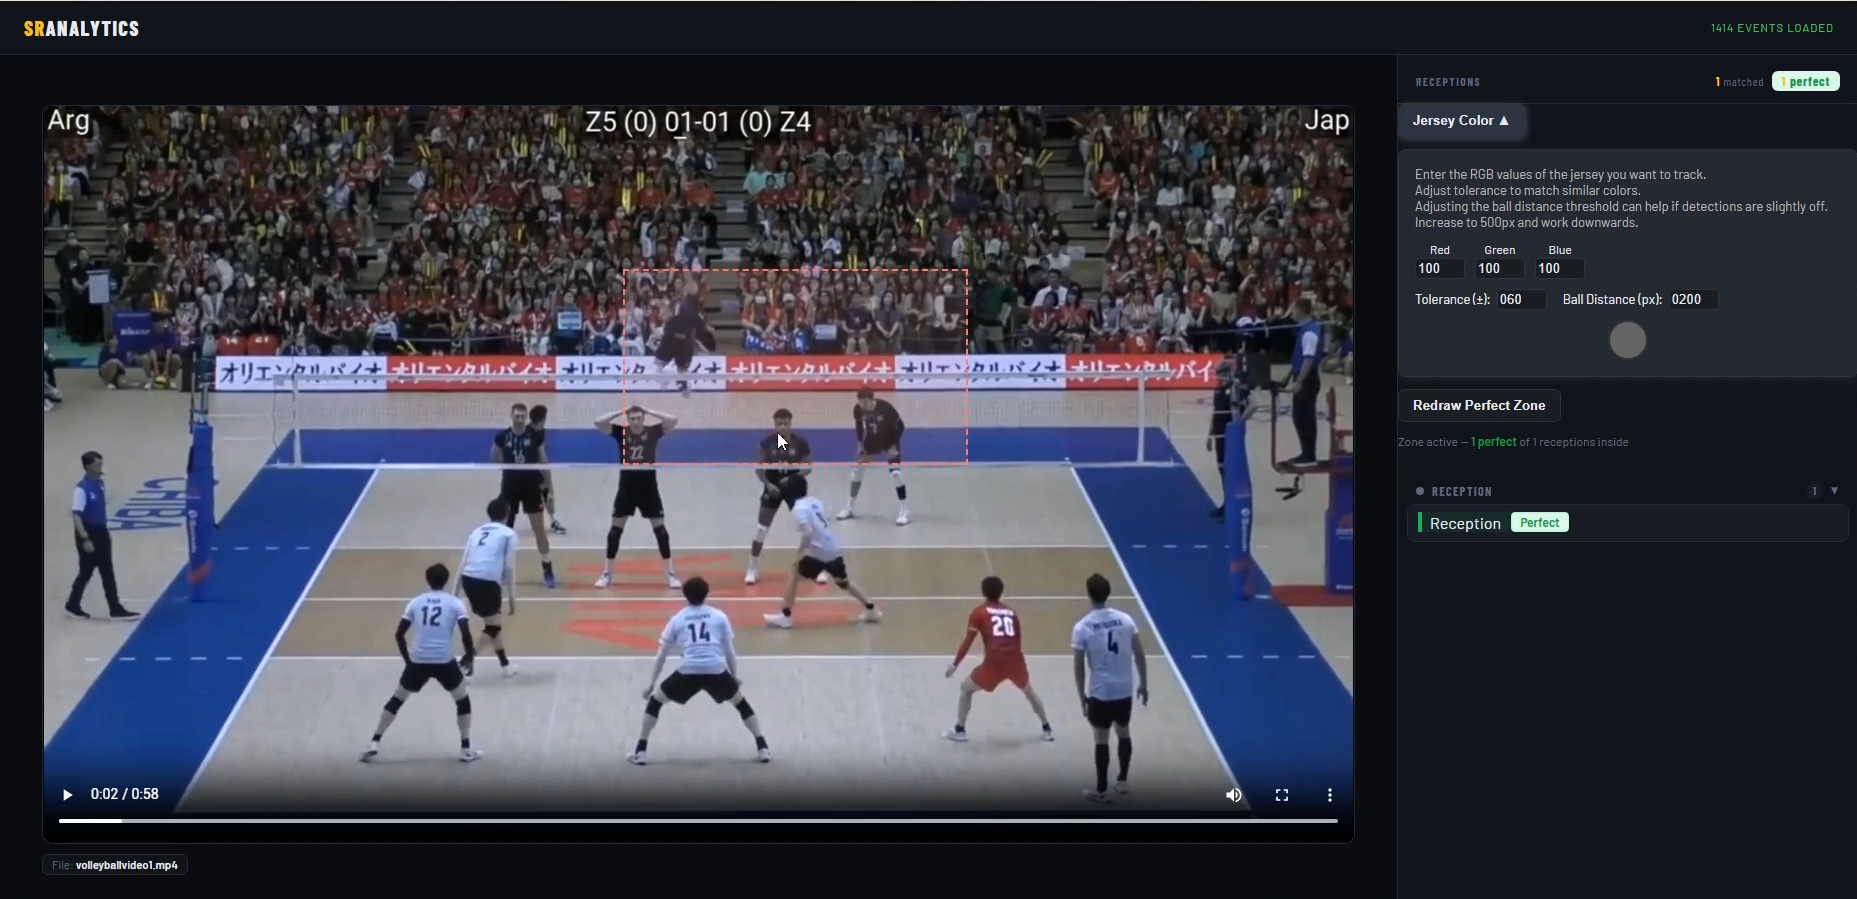
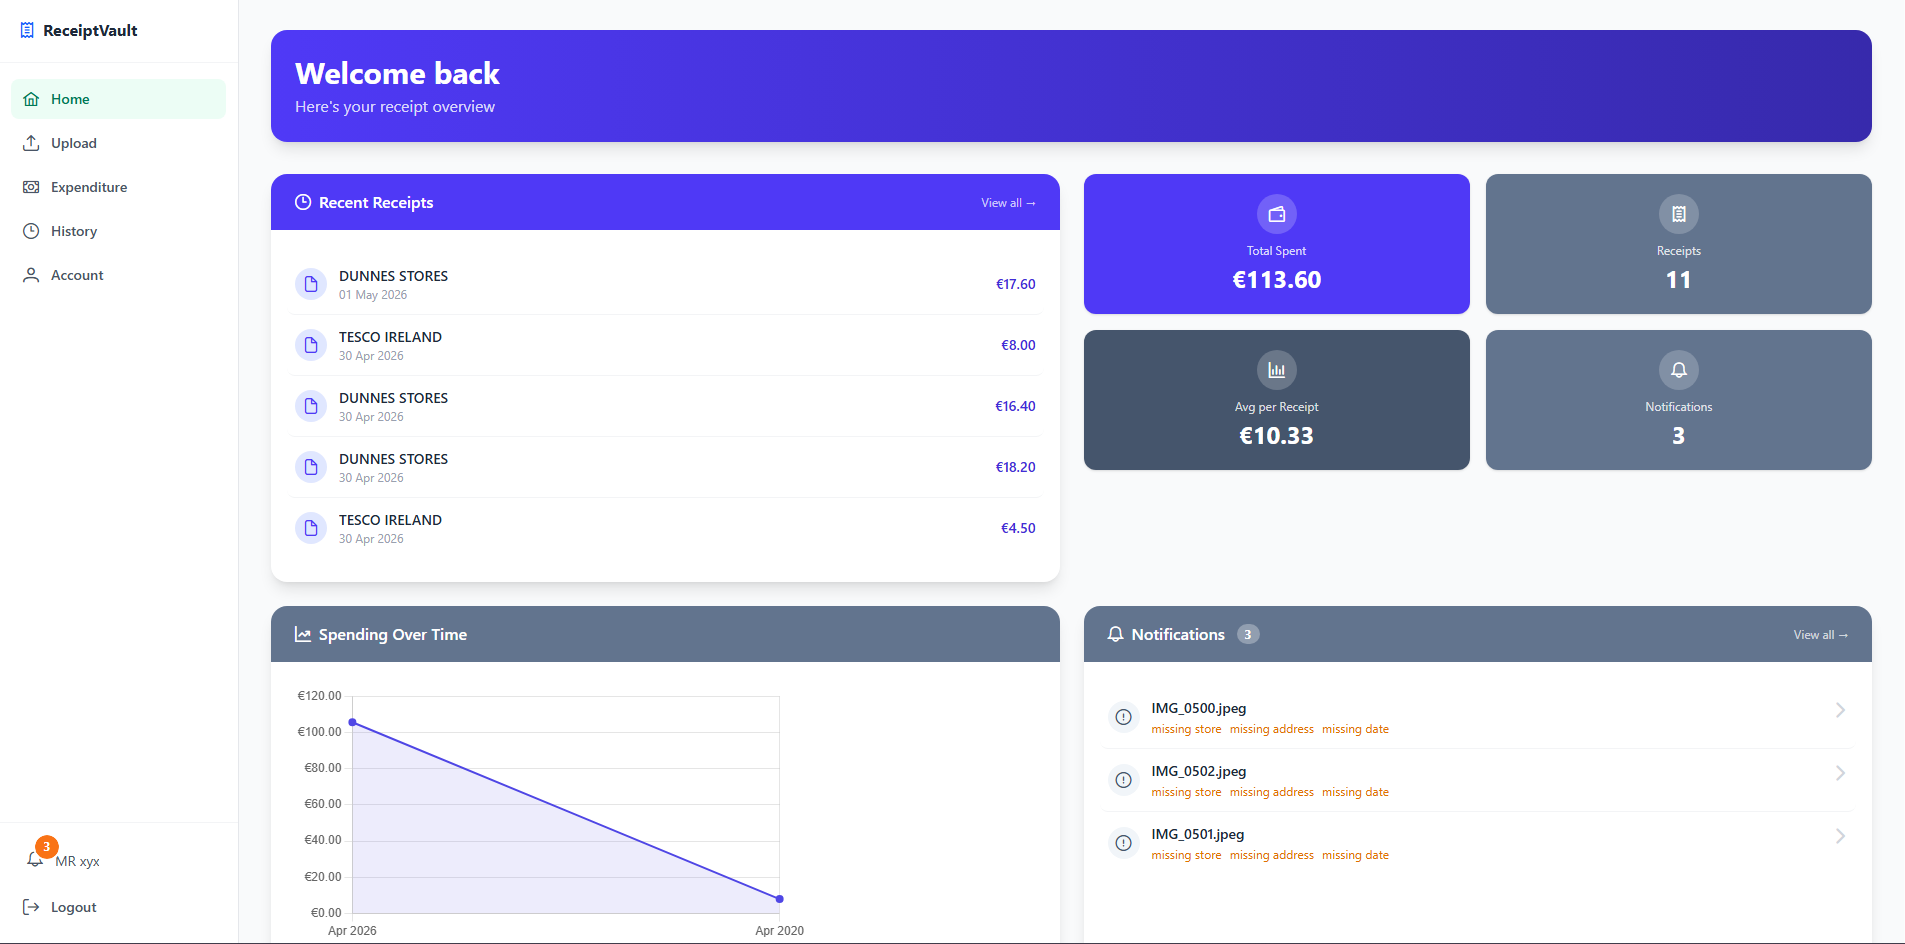
Application Programming Interfaces (APIs) play an important role in modern software development. APIs serve as a way to easily pull and send information from anywhere in the world. Data visualization takes advantage of the power of APIs, in the sense that as data sets get larger, the benefits of data visualization become clearer, providing insights into the data and making it more accessible to a broader audience. This project demonstrates how users can filter and export the raw response data from the APIs and create visualizations and dashboards from the collected data.


Data parsing
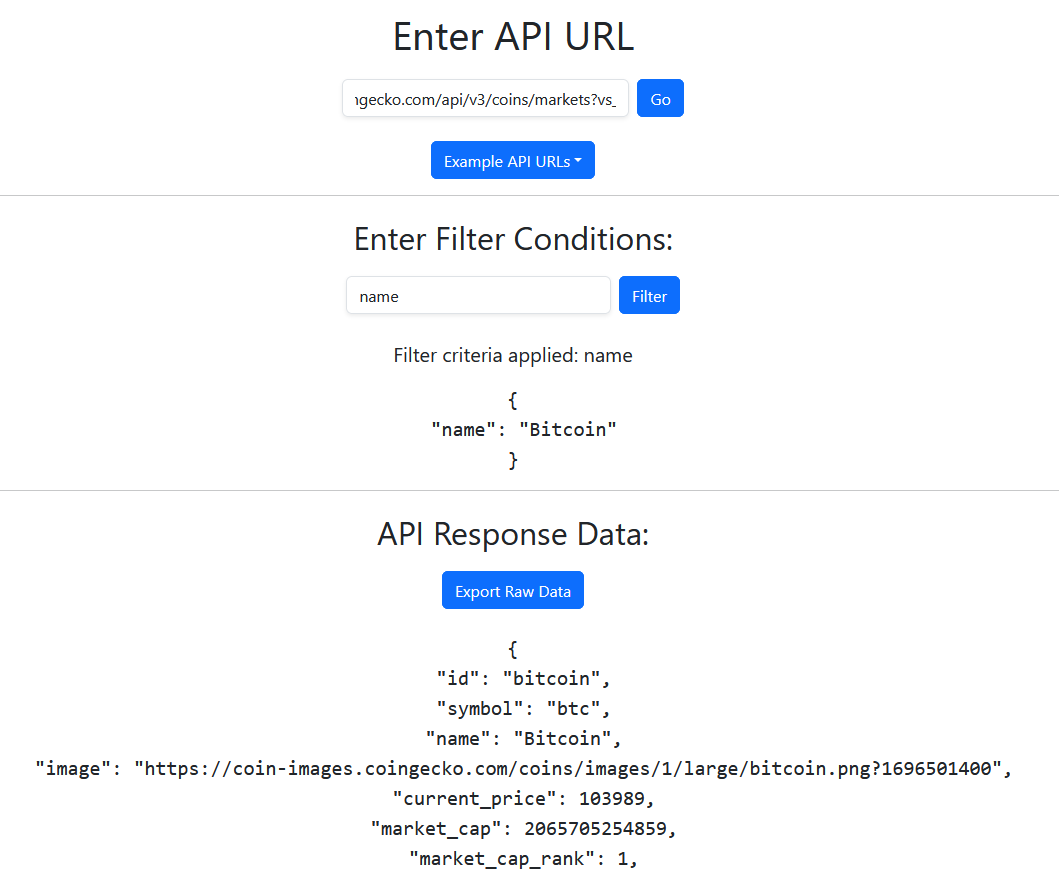
Filter system
Exporting data
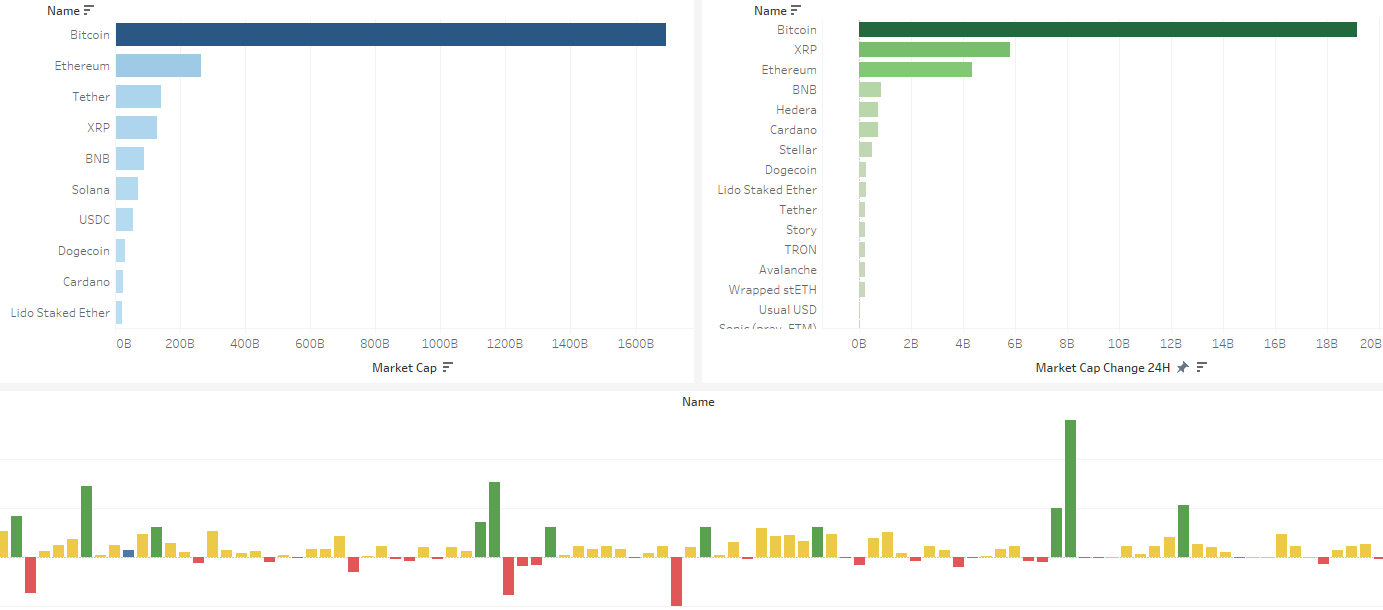
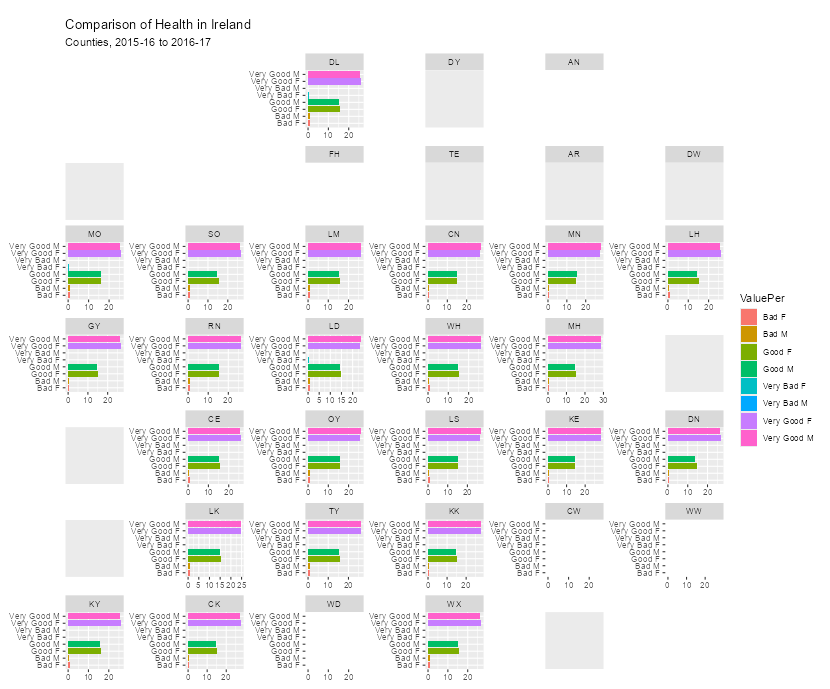
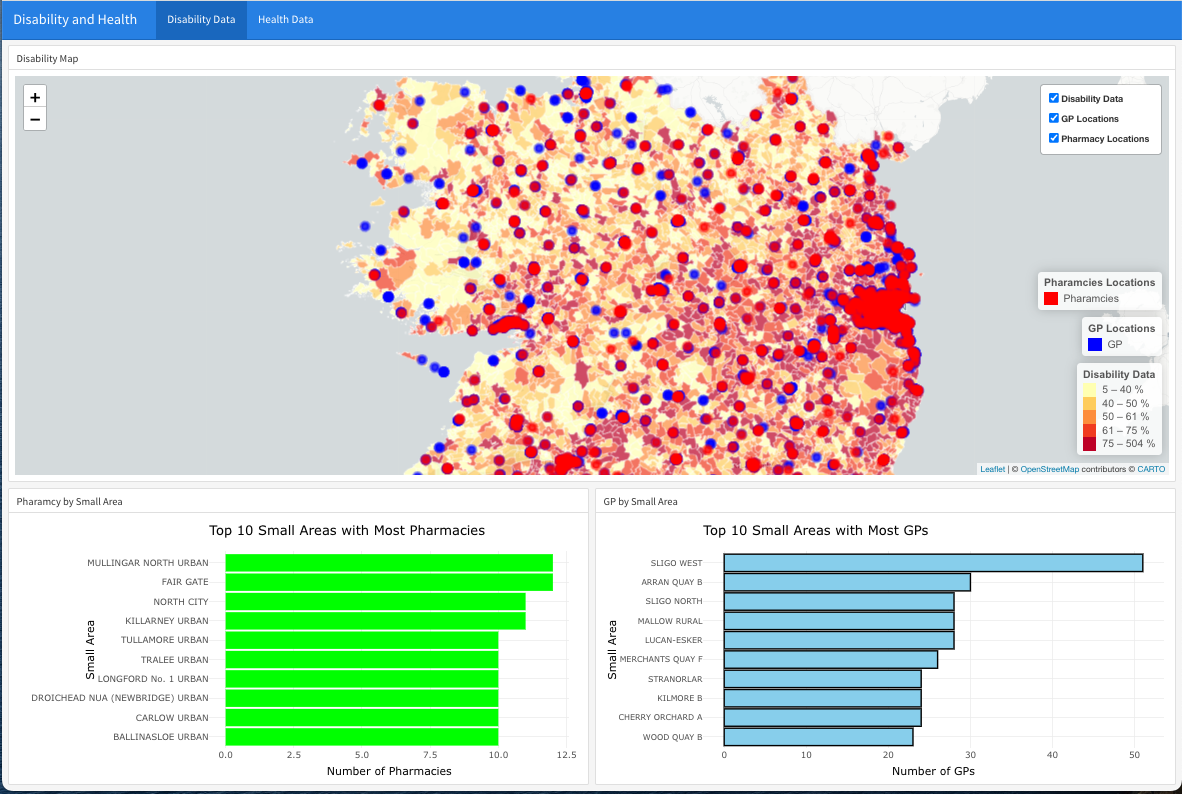
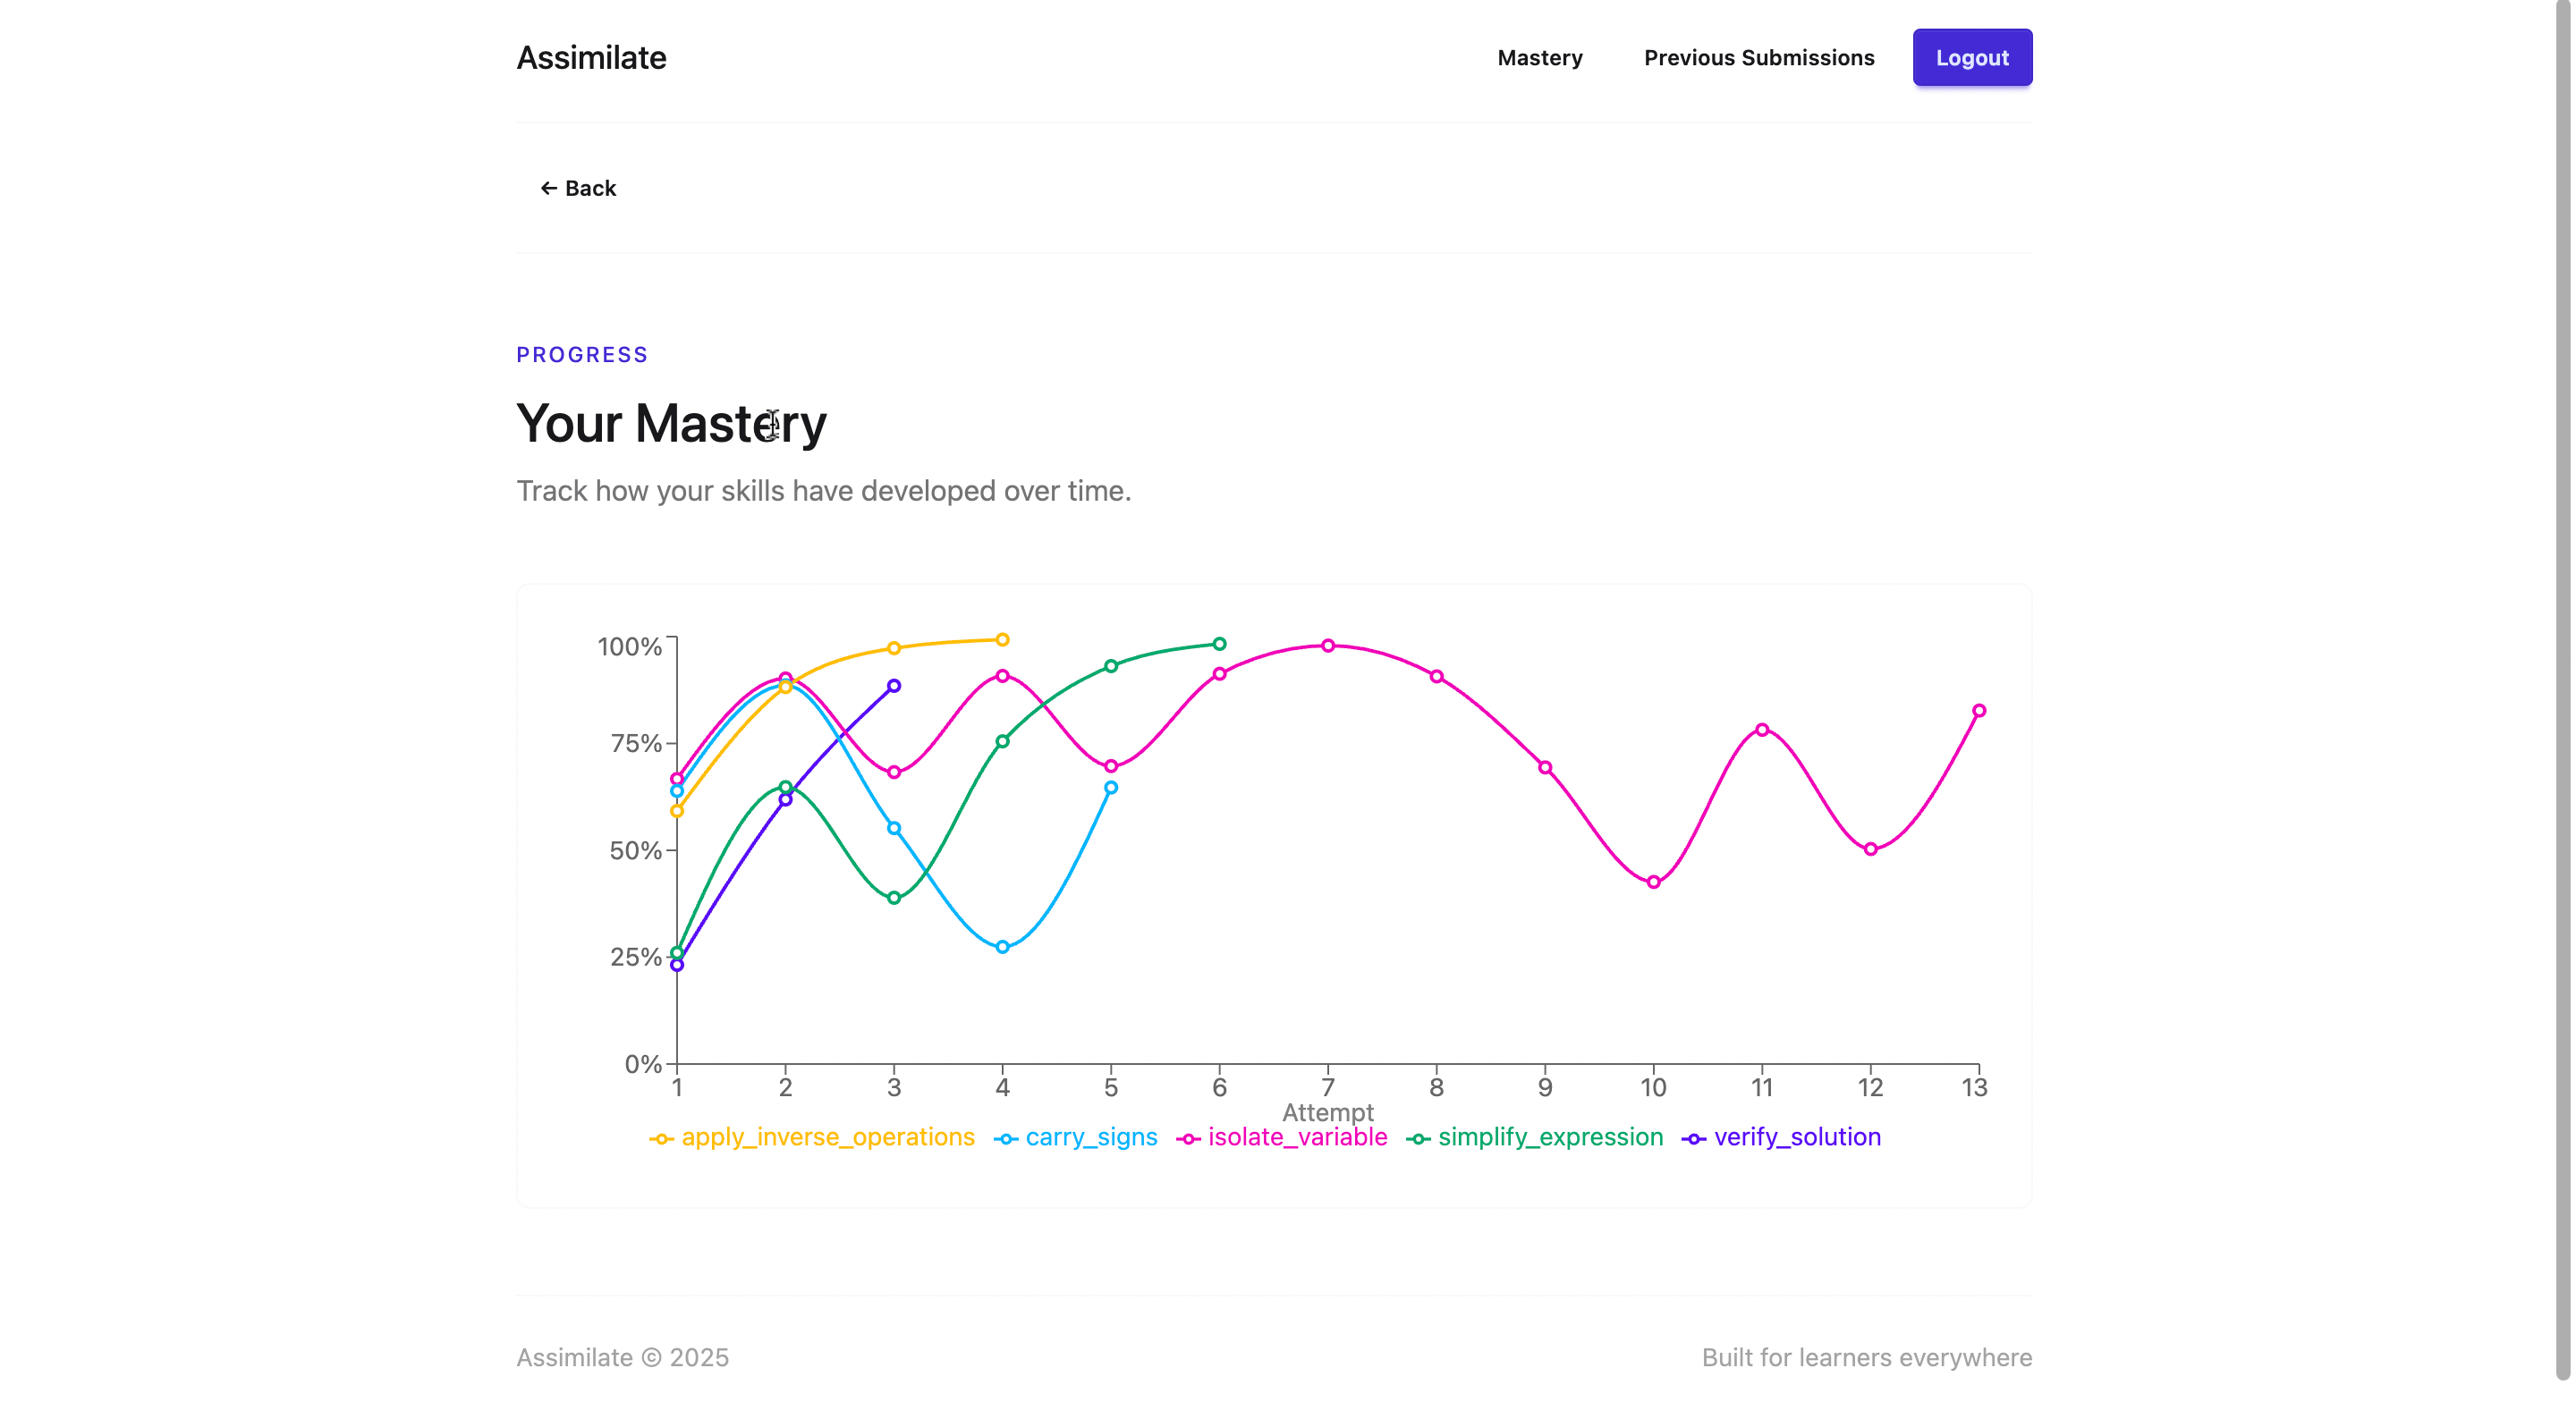
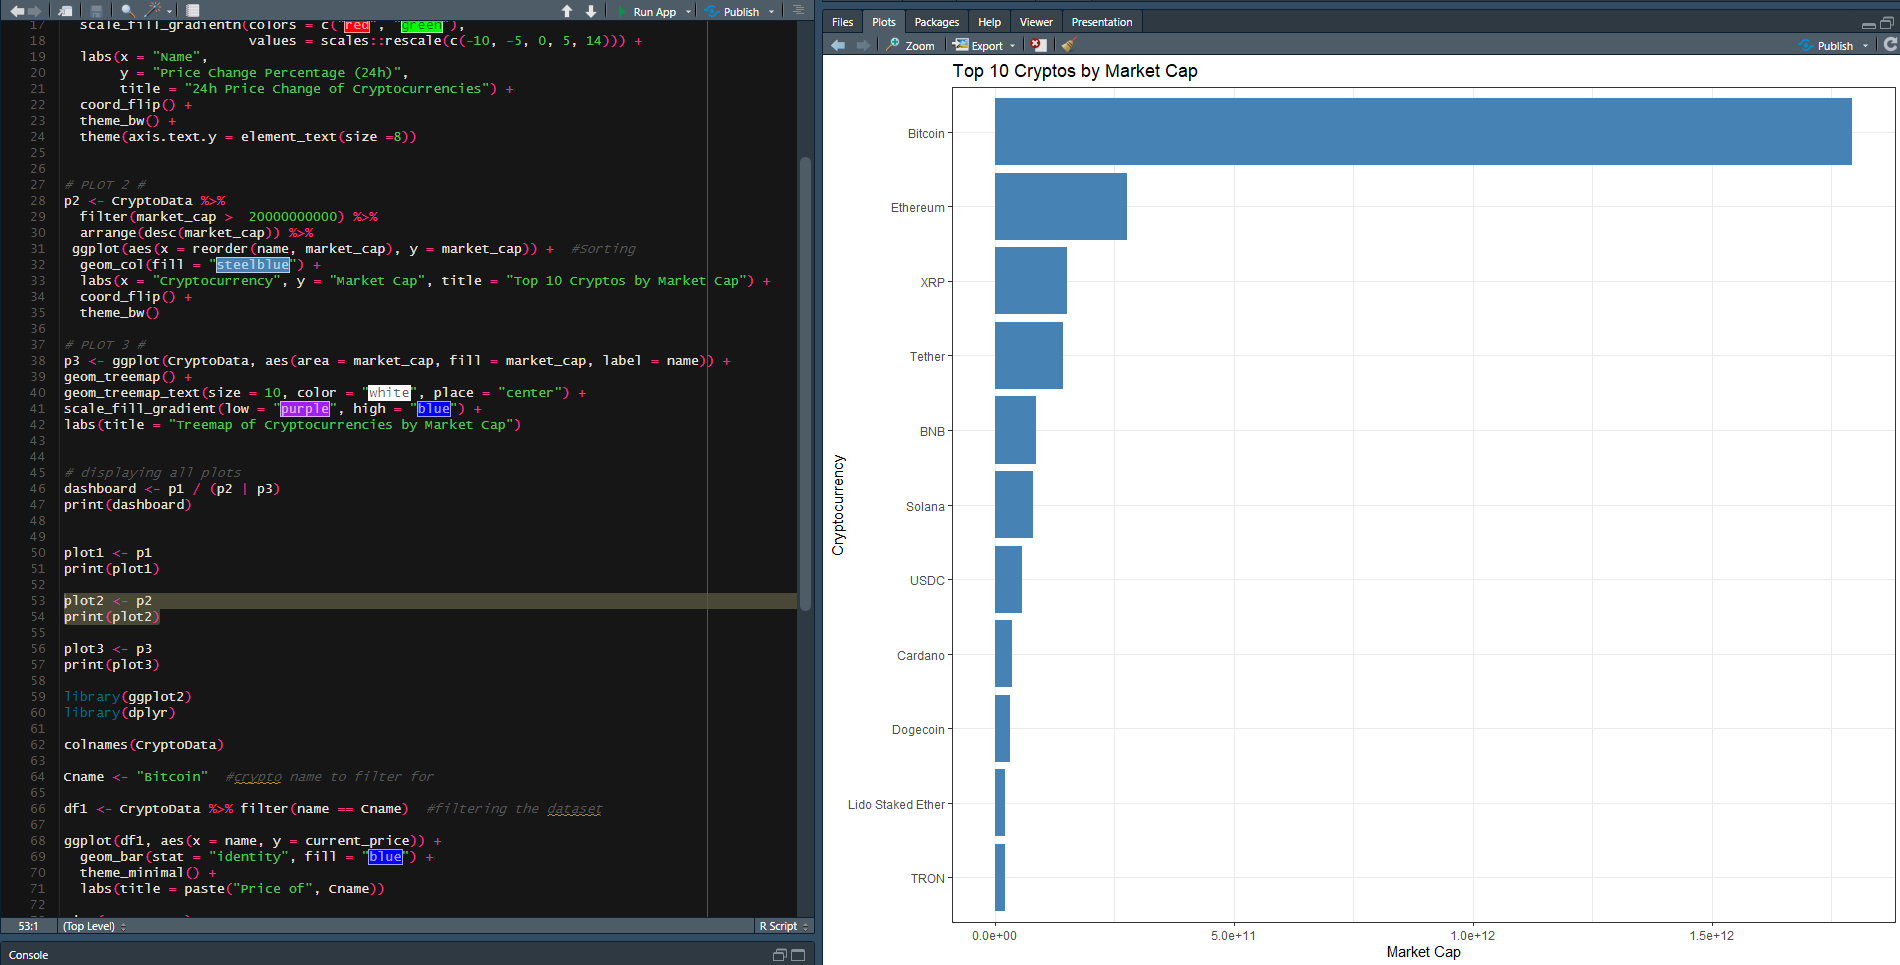
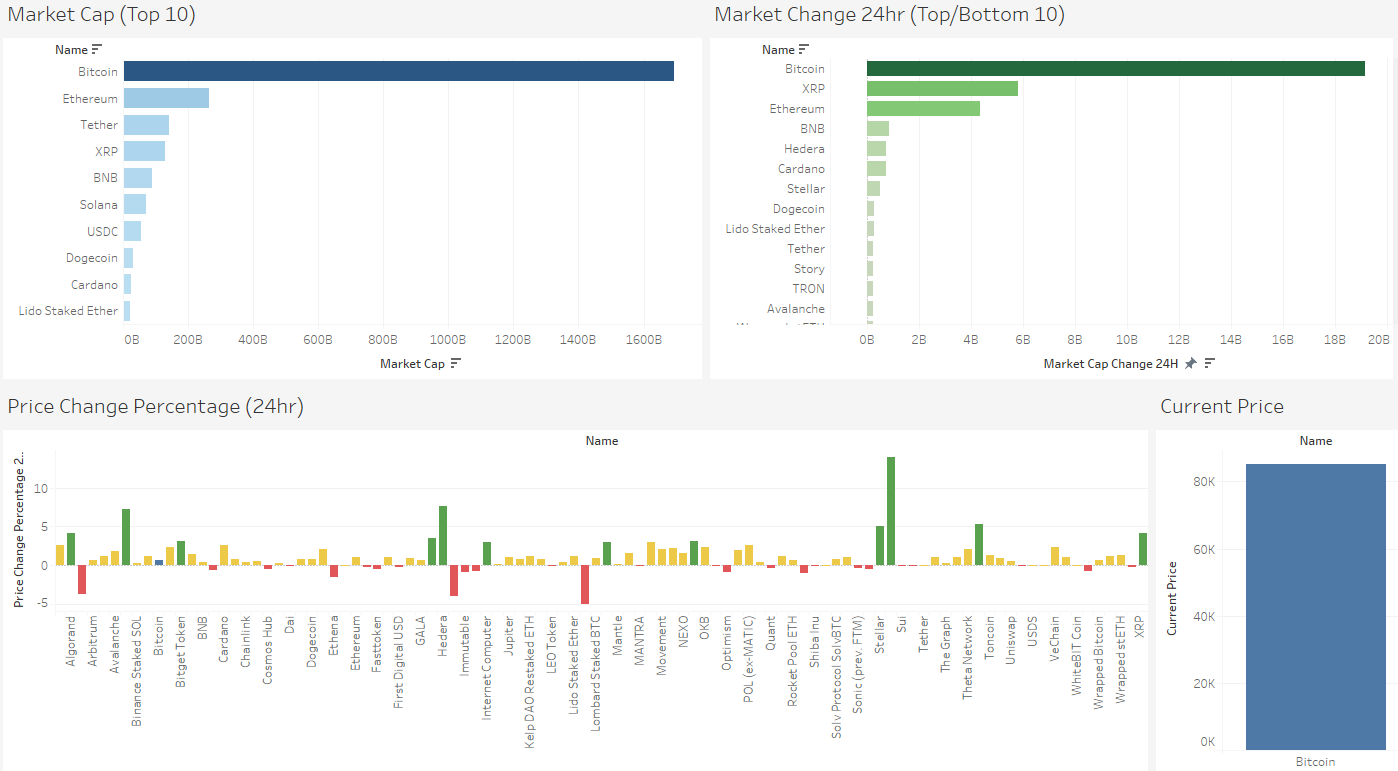
Visualization of data using the software Tableau and R
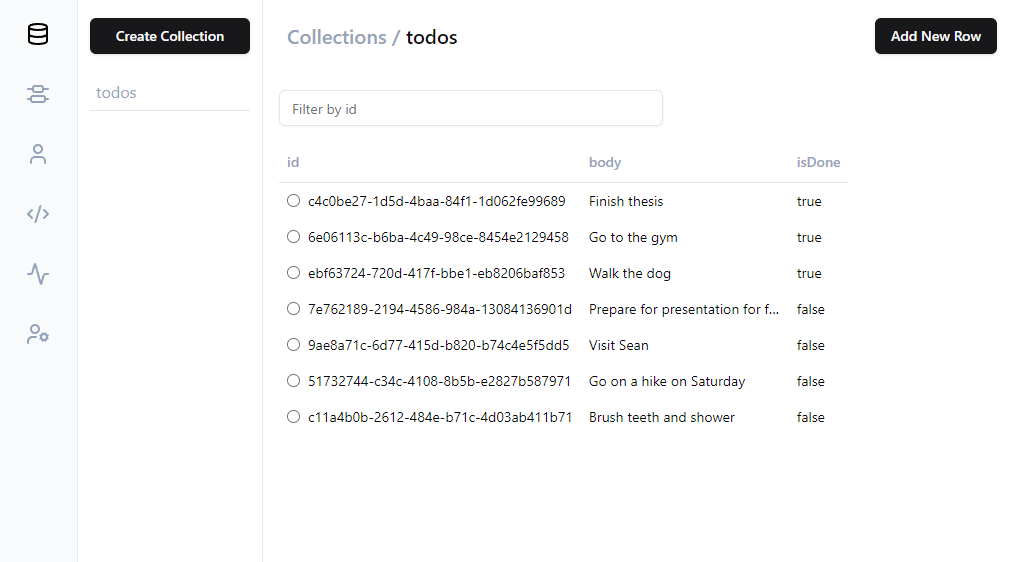
A vast amount of time was dedicated to the exportation of the data, specifically the formatting of it. I applied a number of techniques so that the data would be formatted as expected, such as in “long form”, this means that each column represents a category of data. This format is very beneficial to software like Tableau, as you would only have to drag in two columns of data to create a visualization.
While a proficiency was developed in R, I would have liked to spend more time developing in R, I would have liked to create more visualizations utilizing more packages to create more in-depth, complex, interactive graphs. If I were to start this project again, the R environment would have played a more significant role and the development process in the R environment would have begun much sooner.
The scope of some features such as the filter system, the data exportation and trying to make the application flexible enough to work with every API were too ambitious. Upon reflection, supporting a few core APIs to work with the application would have been a wiser decision. This would allow me to continuously update the application and add support for new APIs based on user feedback.
Ultimately, I believe that I achieved this project's goal of receiving data from an API, parsing through the data and visualizing it in software such as Tableau and R.
Hi, I’m Marlon, I have an interest in APIs, data manipulation, and creating meaningful visualizations from complex datasets. My final project reflects my passion for turning raw data into clear, interactive insights.
Outside of coding, I enjoy gaming and bouldering, which help me stay creative and focused.