Aaron Doyle
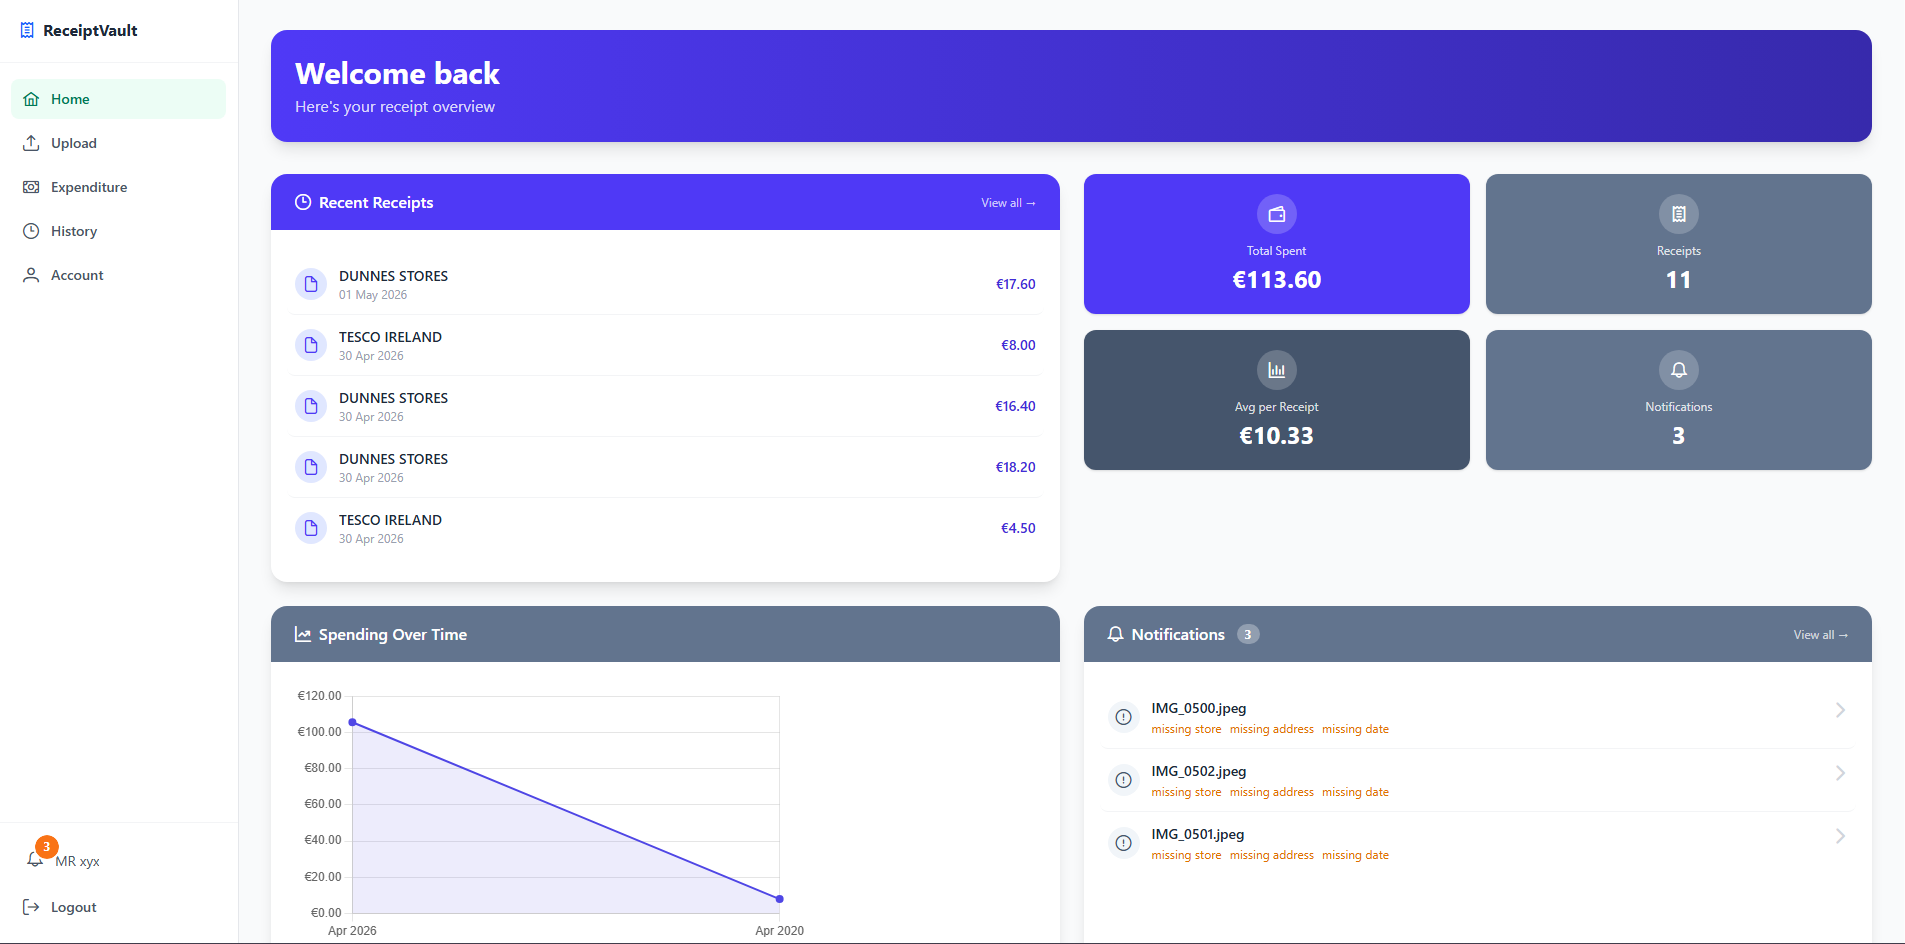
ReceiptVault is a full-stack web application that turns the chore of tracking expenses into a frictionless experience. Snap or upload a photo of any receipt, and the app uses Google Gemini Vision to extract the merchant, date, items, and totals automatically no manual entry required. Built with Flask, MongoDB, and a Vue 3 single-page frontend, it pairs Celery and Redis for background OCR jobs with Pusher for live status updates, so users see results stream in as they're processed.
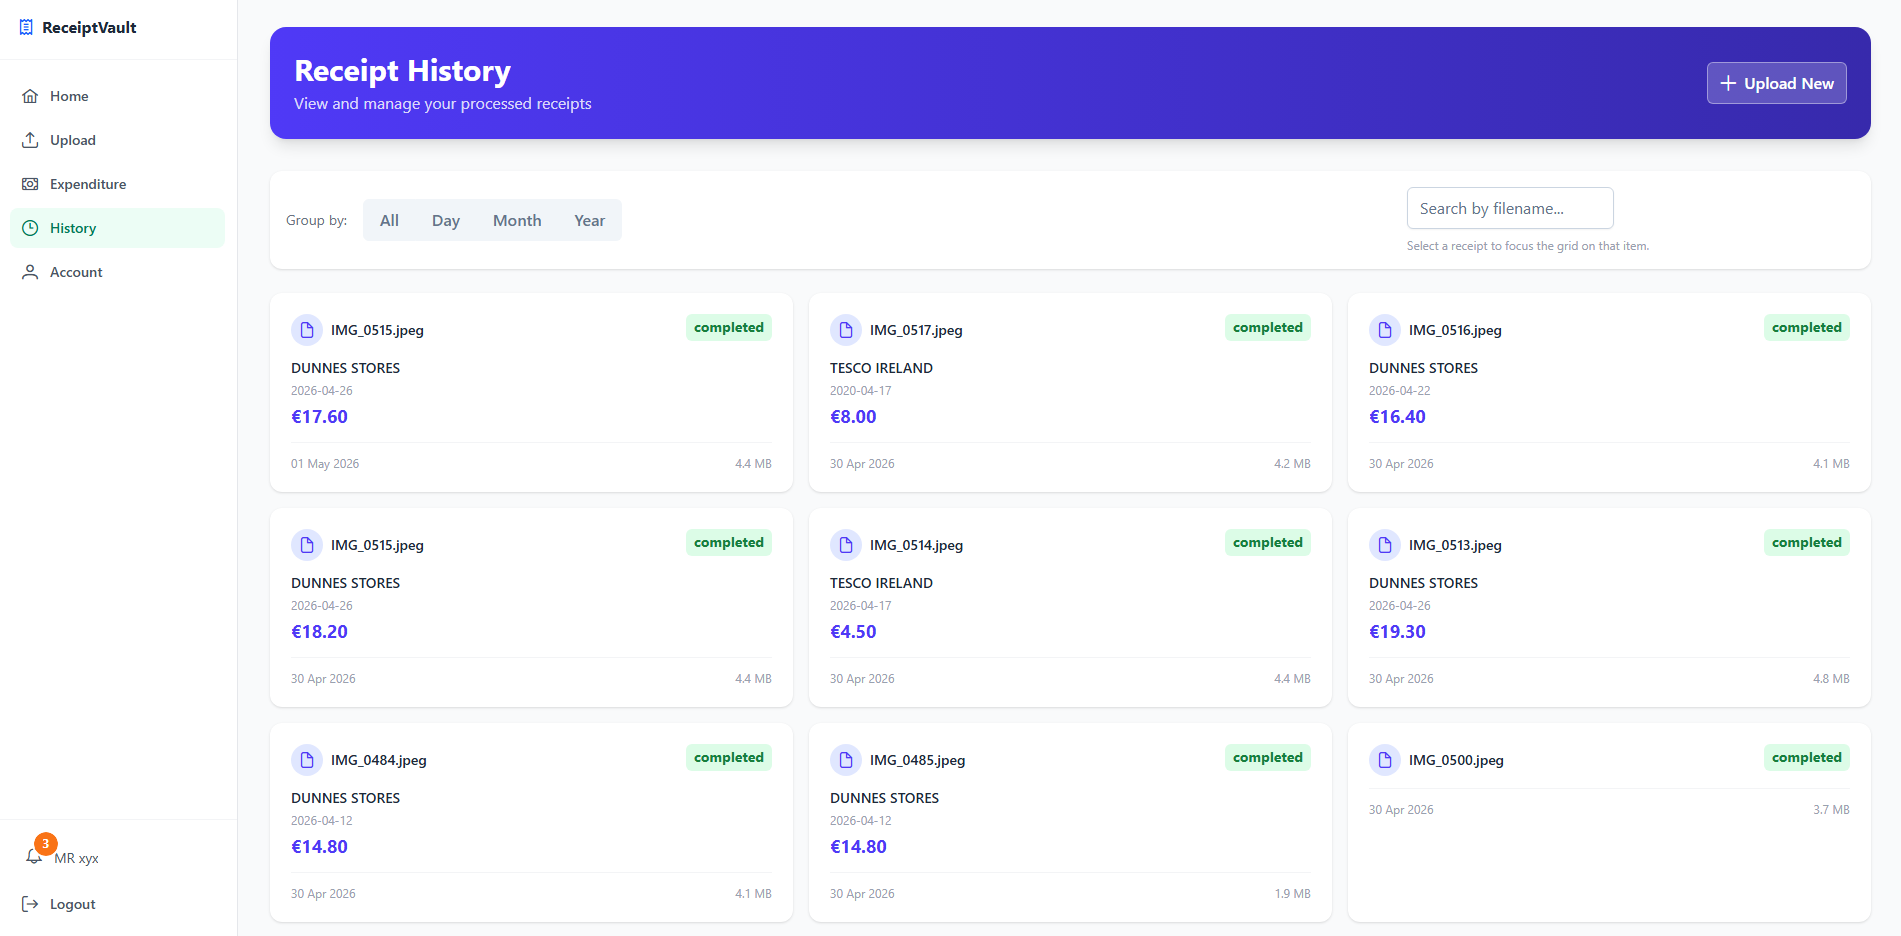
The project set out to solve a common frustration: manually recording purchases from paper receipts is slow, error-prone, and discourages consistent expense tracking. Five objectives guided development.
First, design and build a clean, responsive web interface where users can upload receipt images, review extracted data, and explore their spending. Second, develop a backend system that authenticates users, stores images securely in AWS S3, and parses them using a vision-language model. Third, process receipts asynchronously through a background task queue so the interface never blocks while waiting on AI inference. Fourth, provide spending analytics and real-time status notifications so users can see exactly where each receipt is in the pipeline. Fifth, produce a deployable prototype demonstrating how modern vision-language models, cloud storage, and asynchronous architecture come together in a practical application.
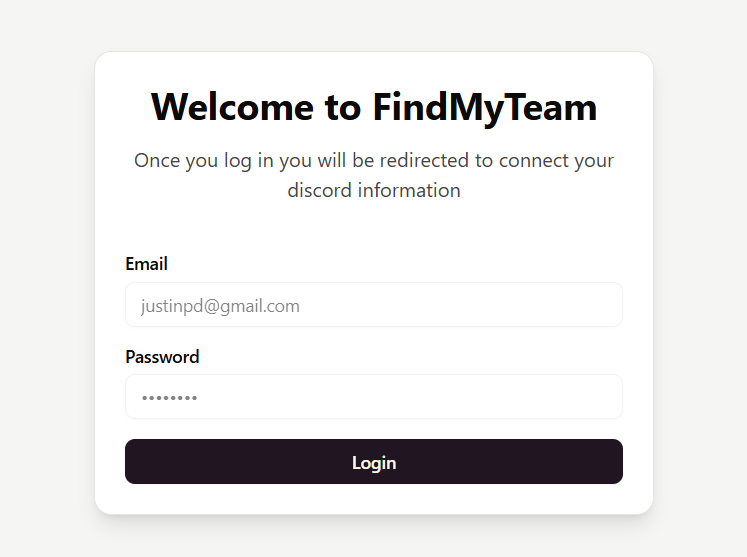
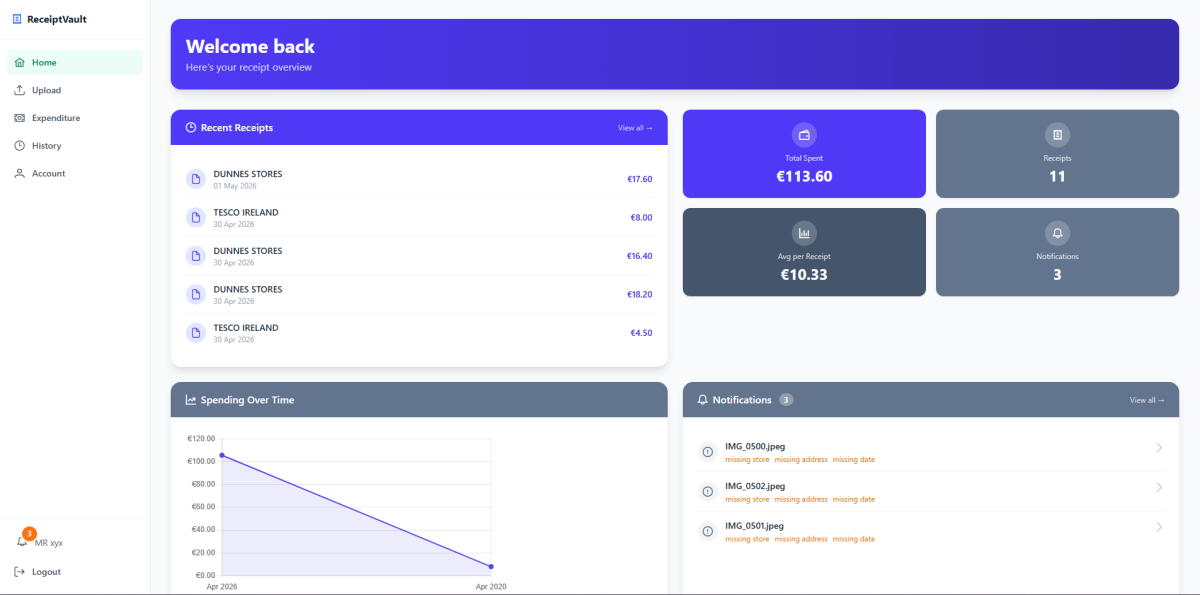
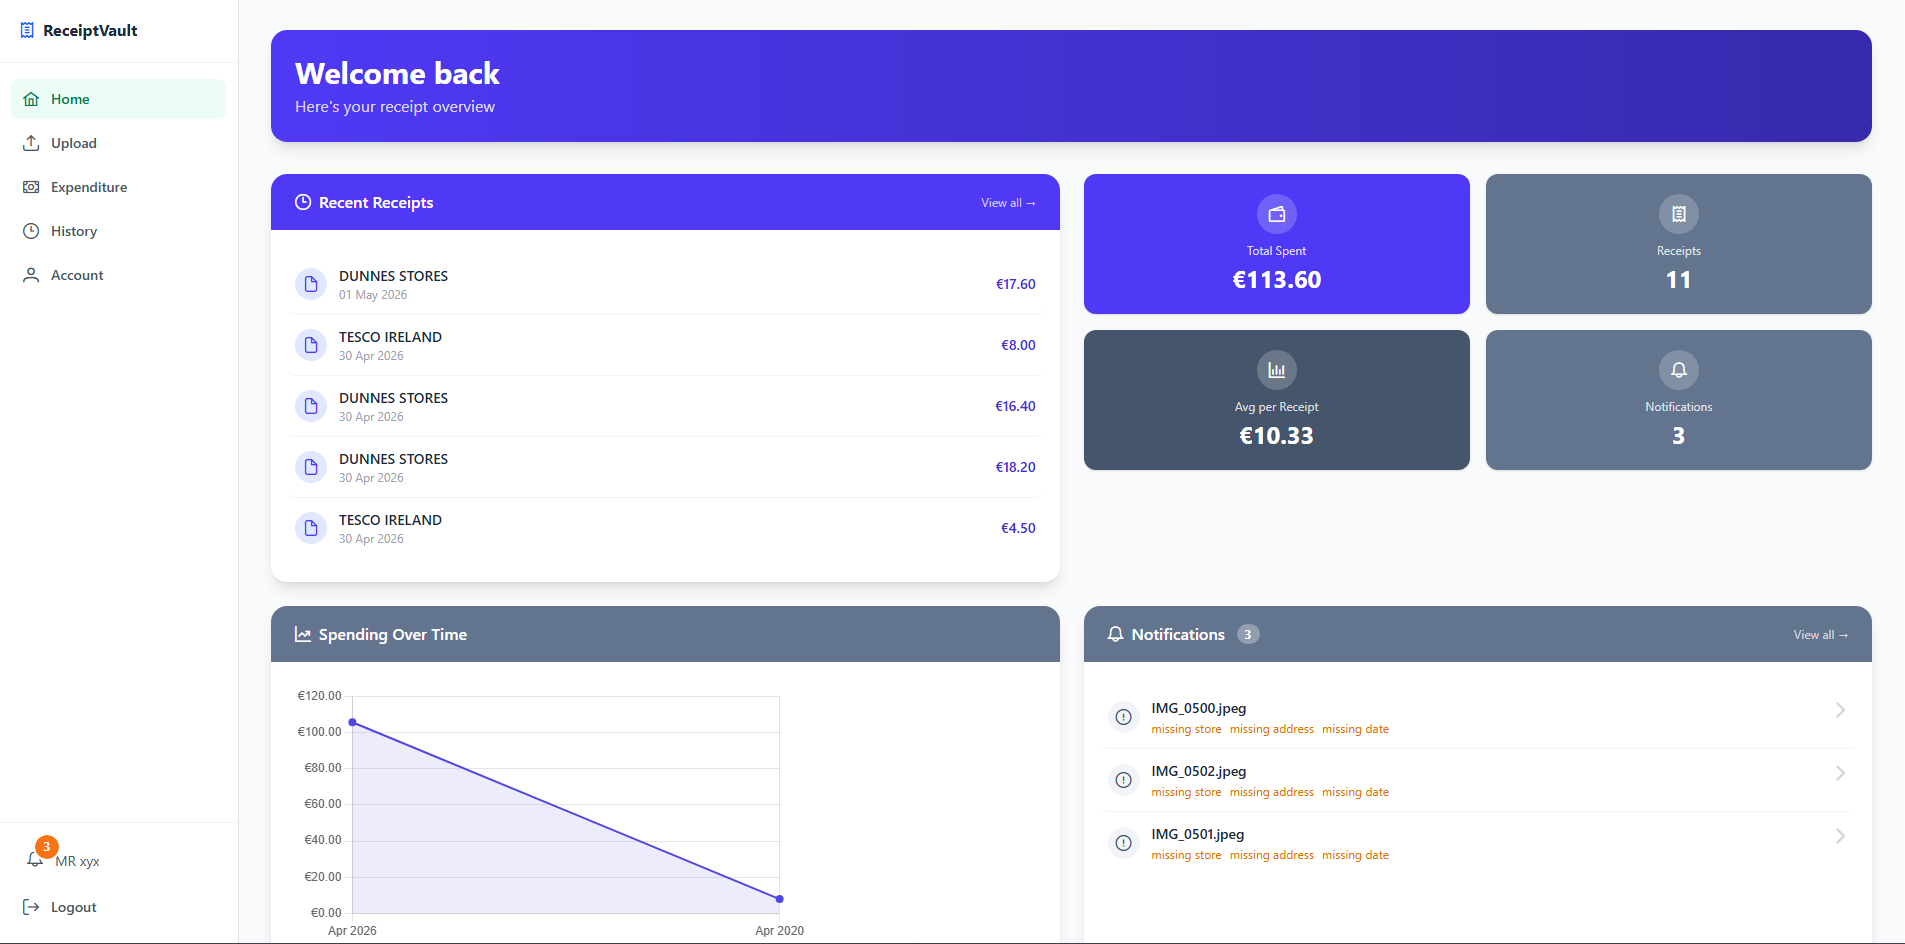
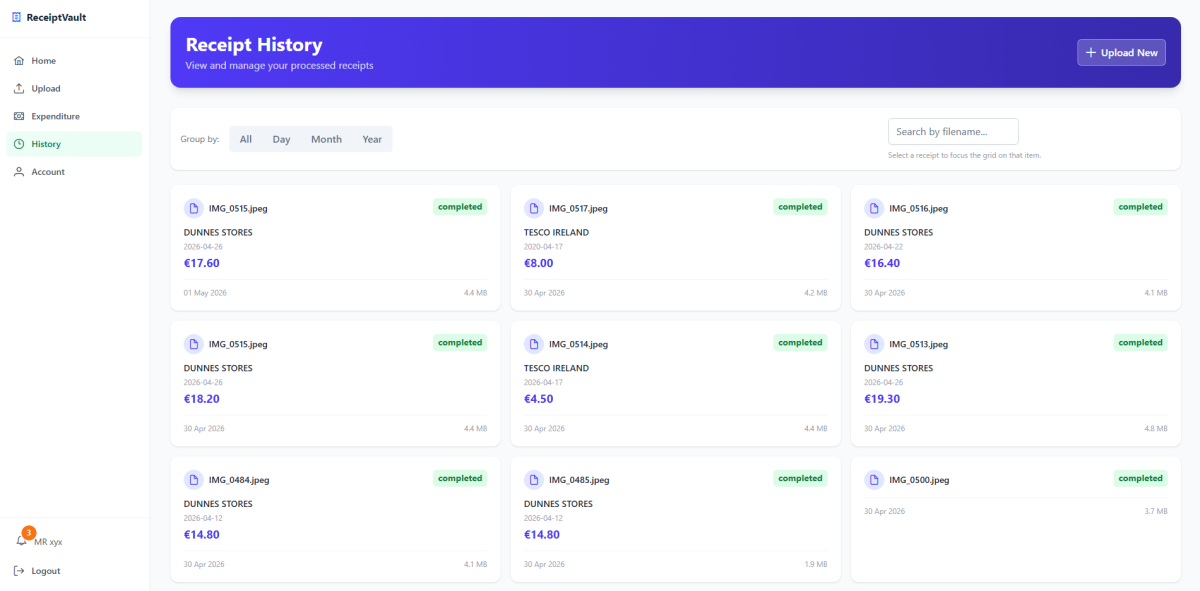
The final system meets all five objectives. Users can register, log in, upload receipts via drag-and-drop, and receive parsed results within seconds. Google Gemini 2.5 Flash extracts merchant names, dates, individual line items, tax, and totals into structured JSON, which users can then review and edit. The Celery and Redis queue handles parsing in the background with automatic retries, and Pusher pushes live status updates to the browser so users always know whether a receipt is uploading, processing, or complete.
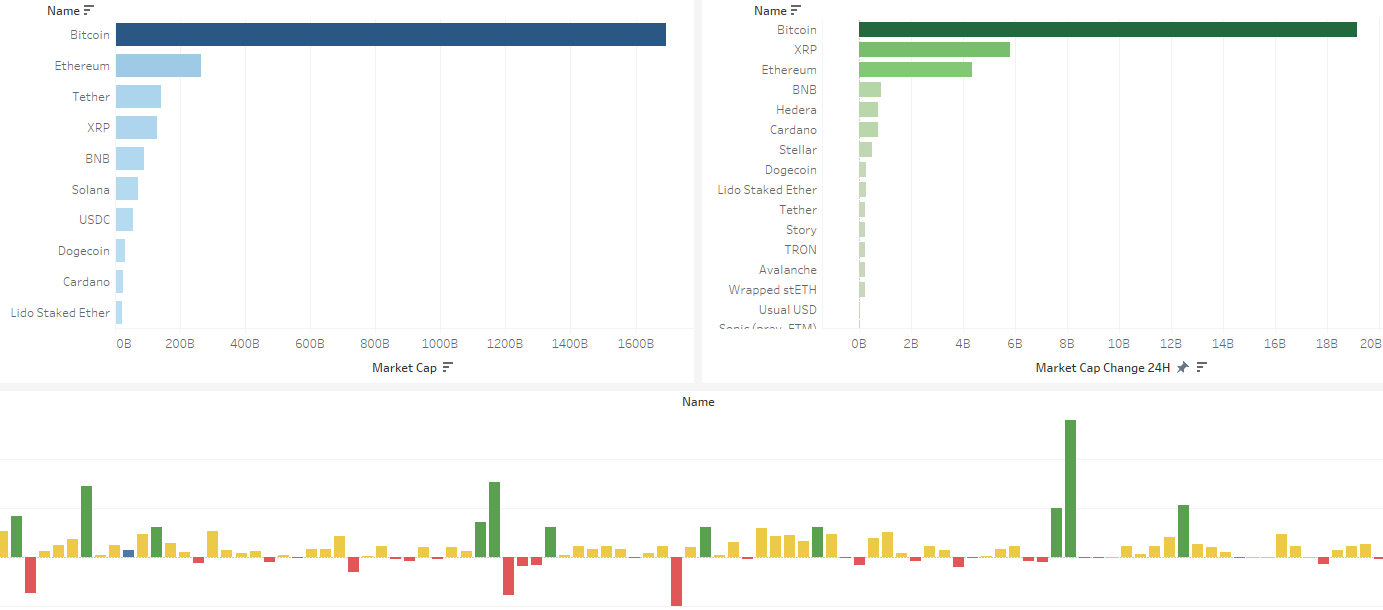
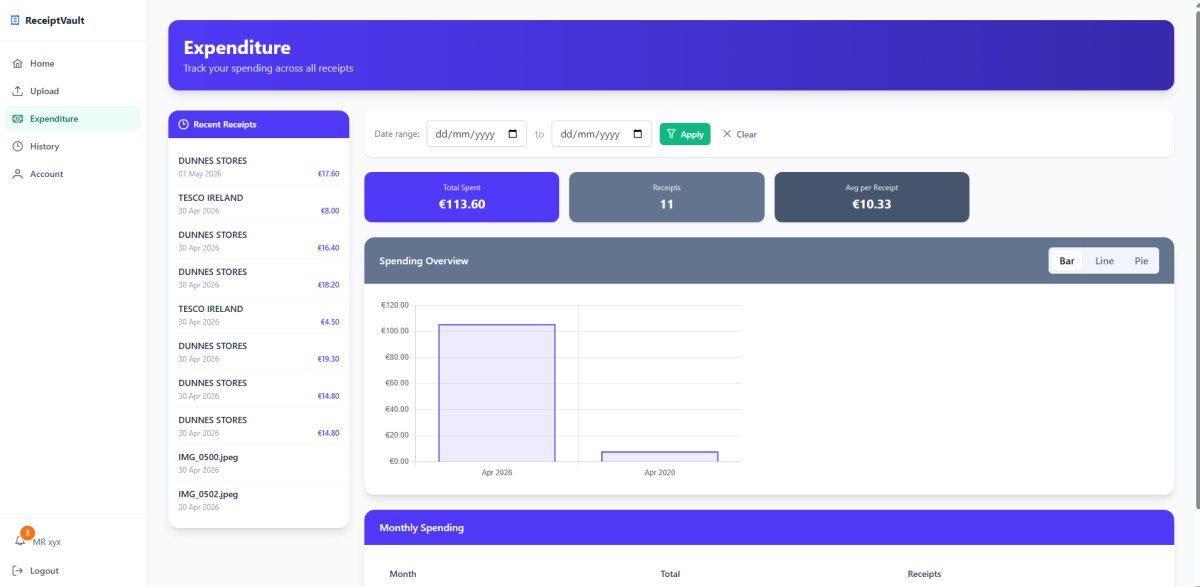
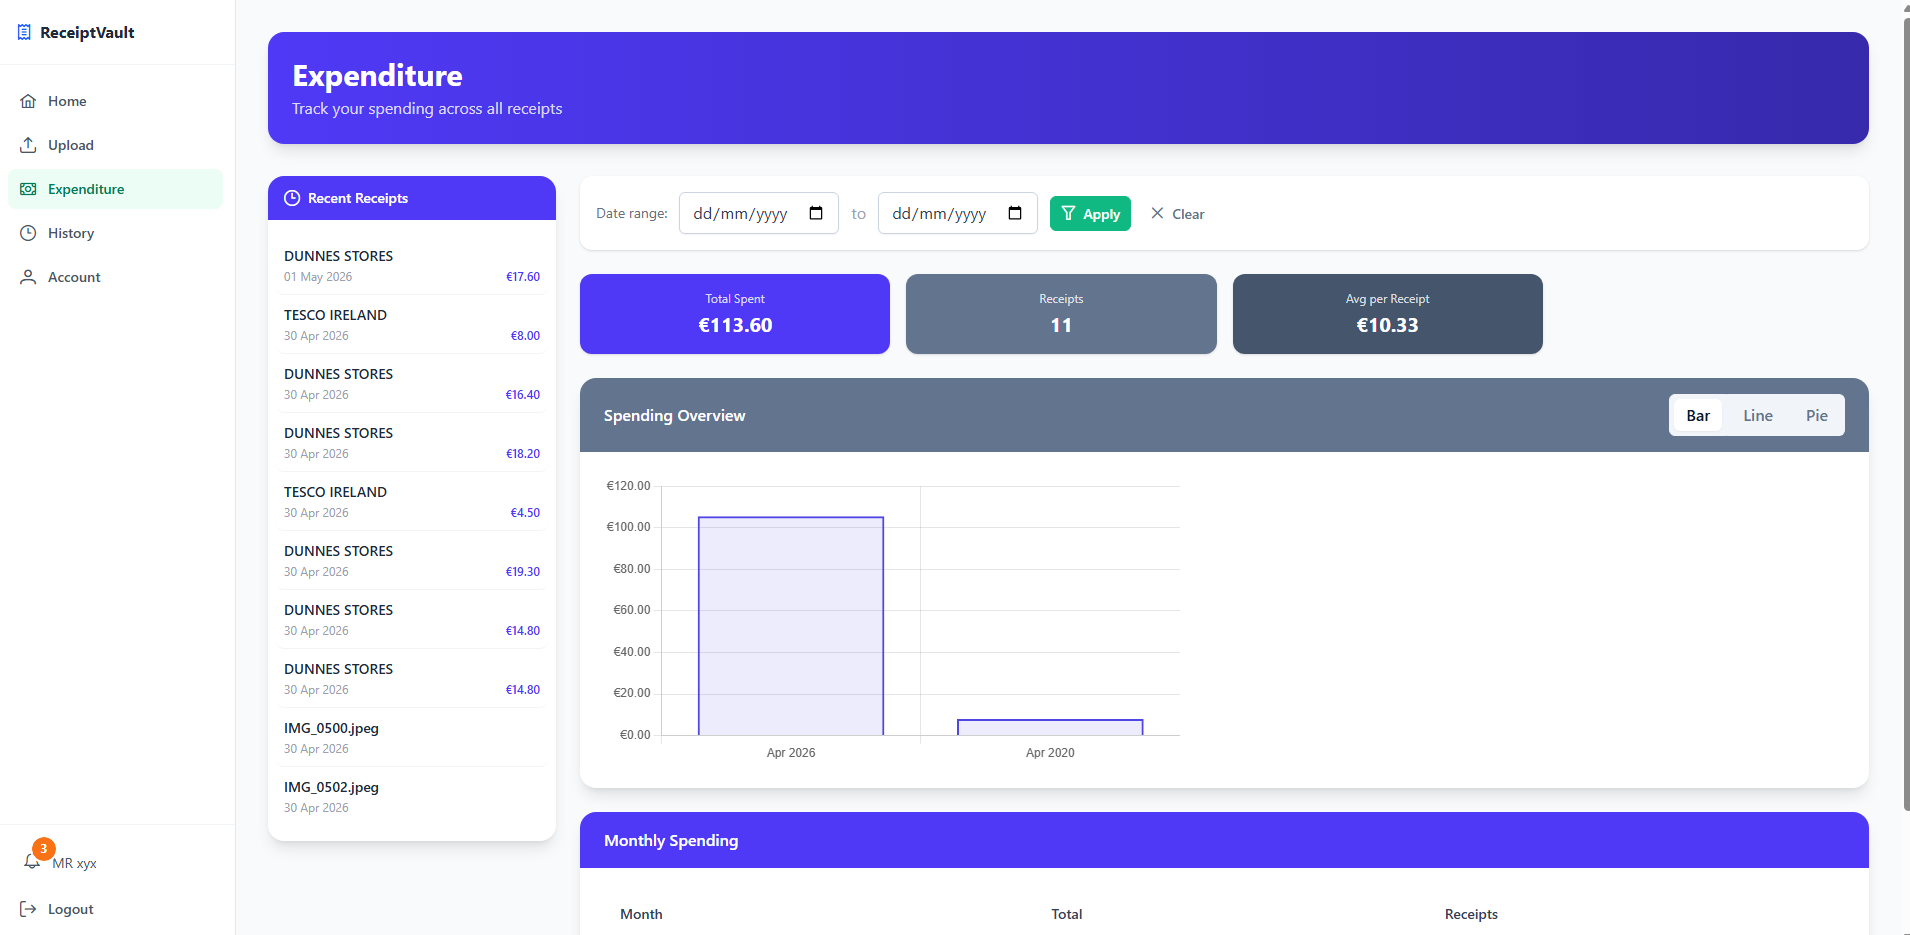
The Vue 3 frontend provides nine views including upload, history, receipt detail, edit, expenditure analytics, and account management. The expenditure dashboard uses Chart.js to visualise spending by store and over time, giving users a practical budgeting tool. The system is containerised with Docker Compose and deployed to Render via a blueprint configuration, with a custom domain purchased through Name.com.