Oliver O Keeffe
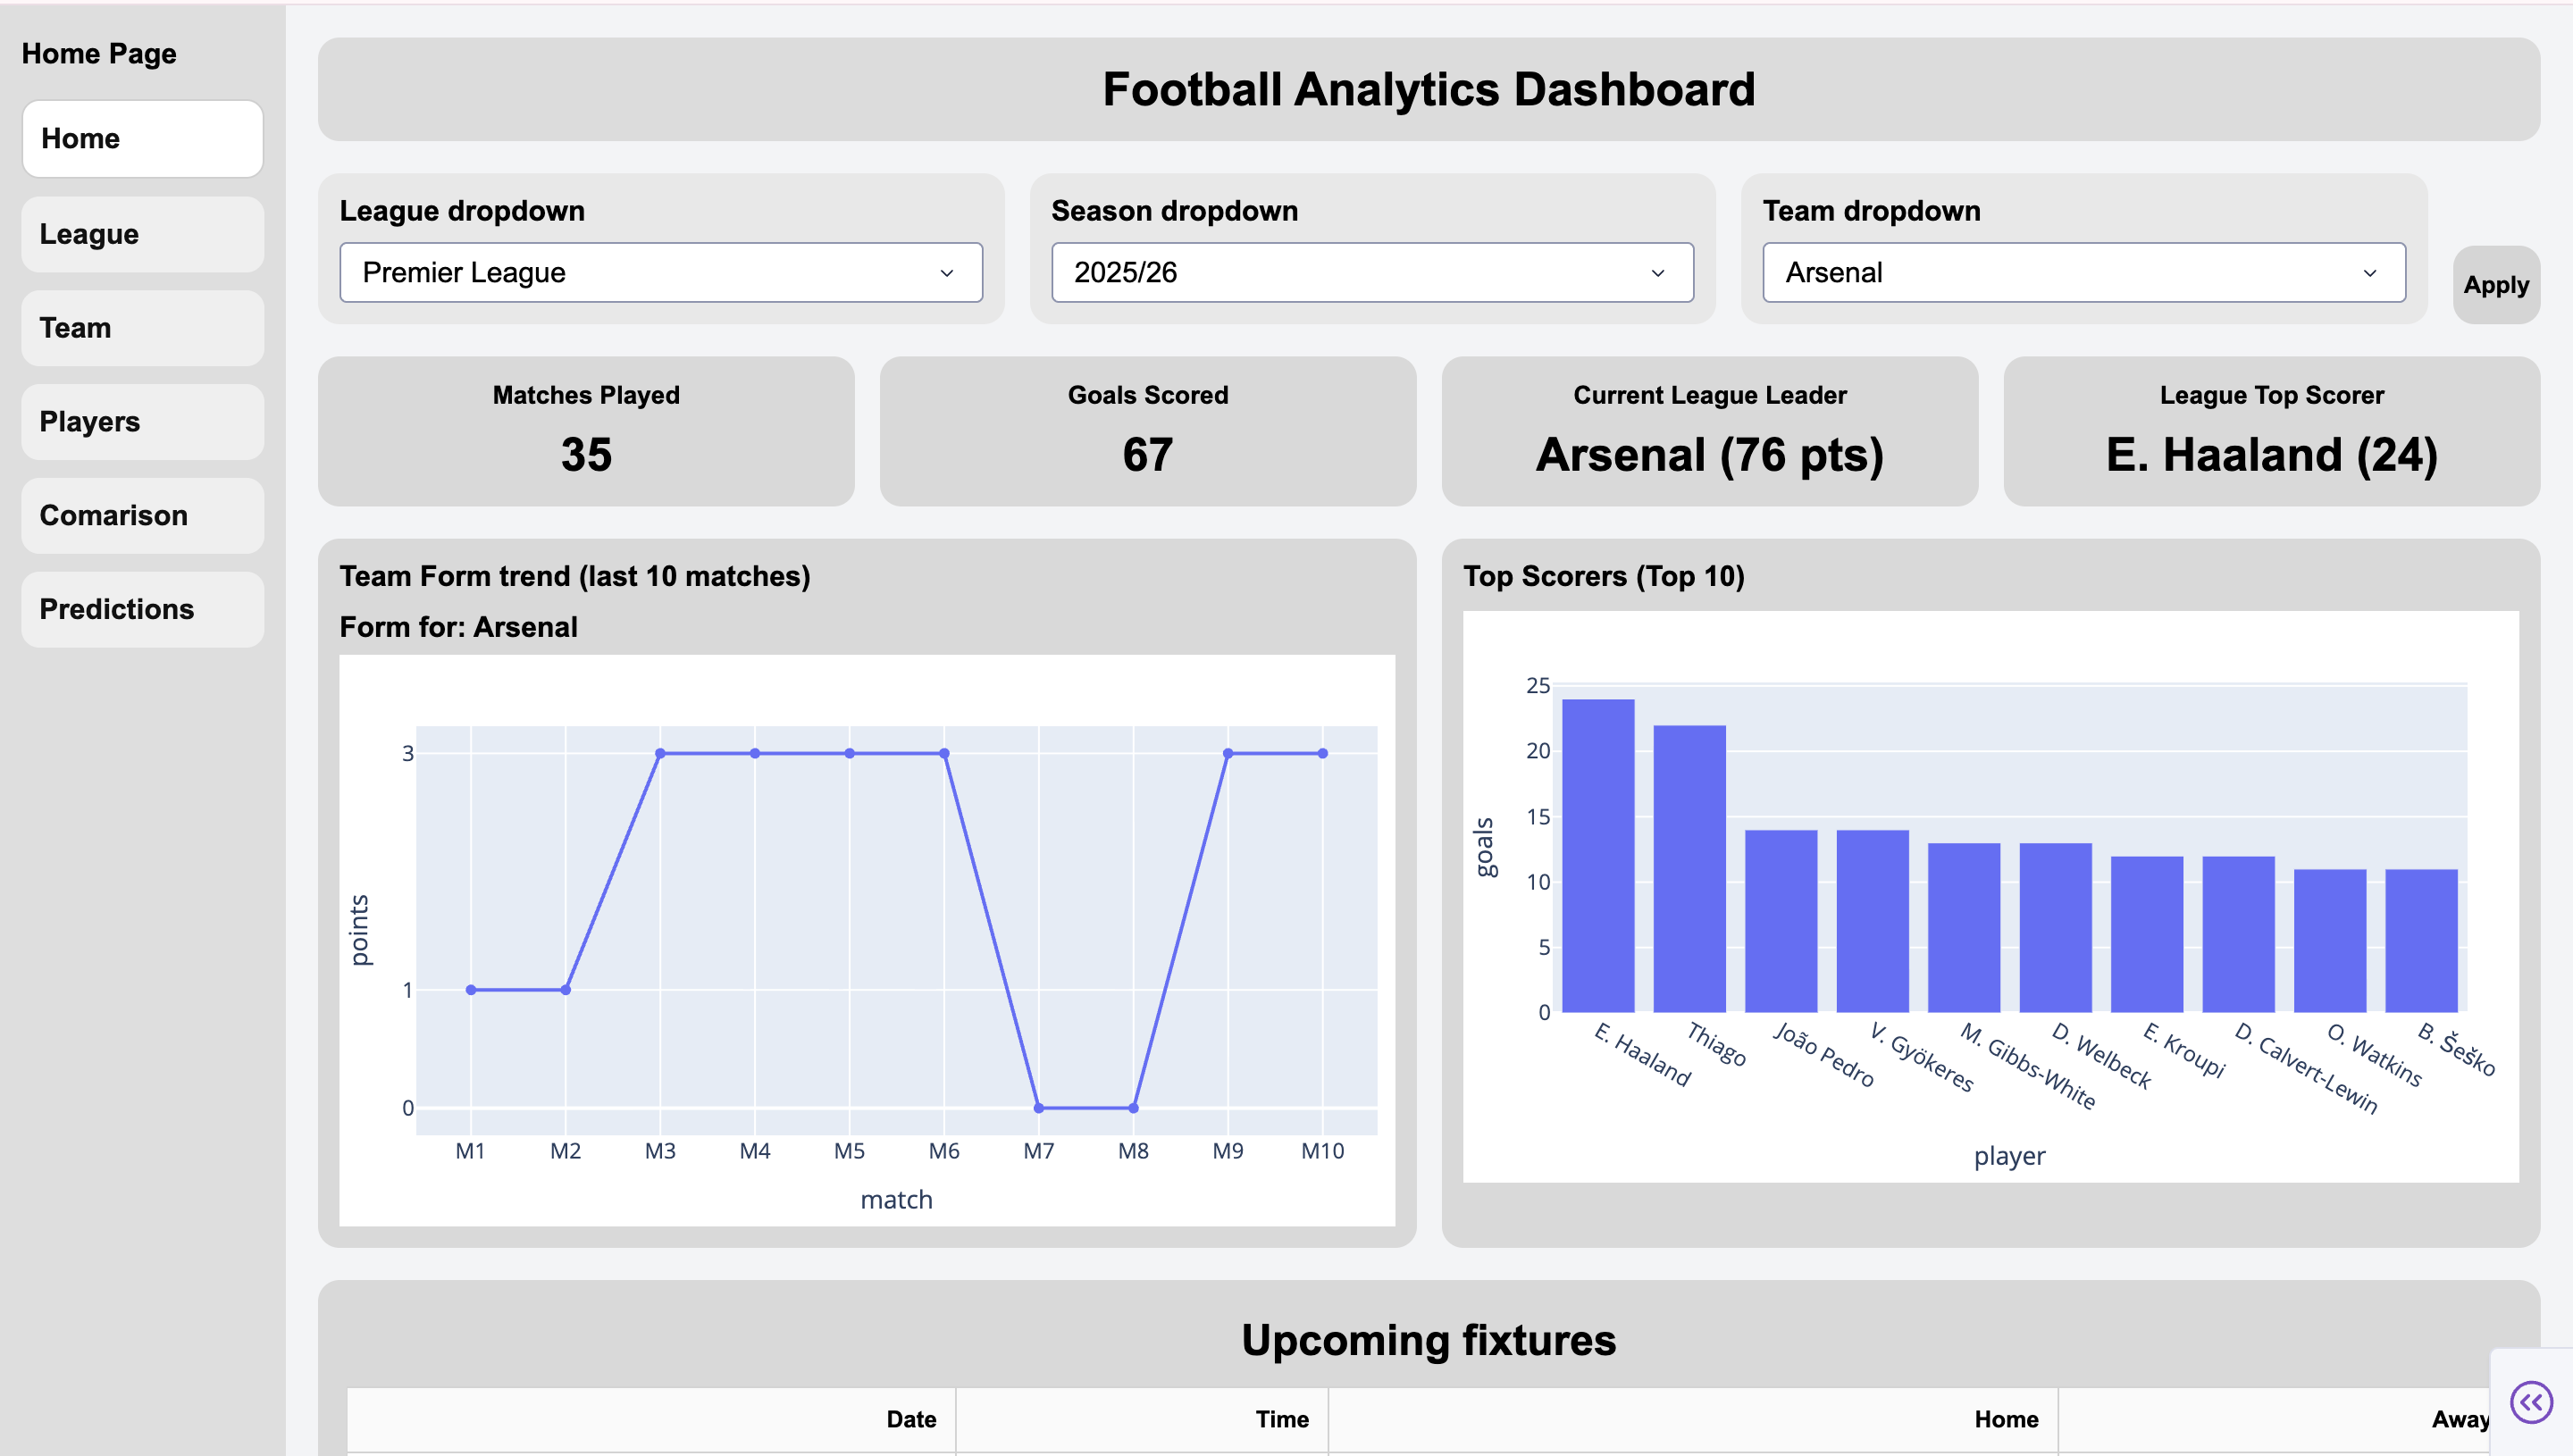
The aim of this project is to create a dynamic and interactive website dashboard that allows users to explore and visualise football statistics using a range of different graphical forms. The data is read and formatted from an external API. The dashboard also provides predictions for upcoming games.

• To integrate a football statistics API to retrieve real-time data that include results,
fixtures, league tables and player stats
• Develop and design a user-friendly website for navigating all stats
•Create interactive charts that visualise key football stats
• Implement multiple filter and search features
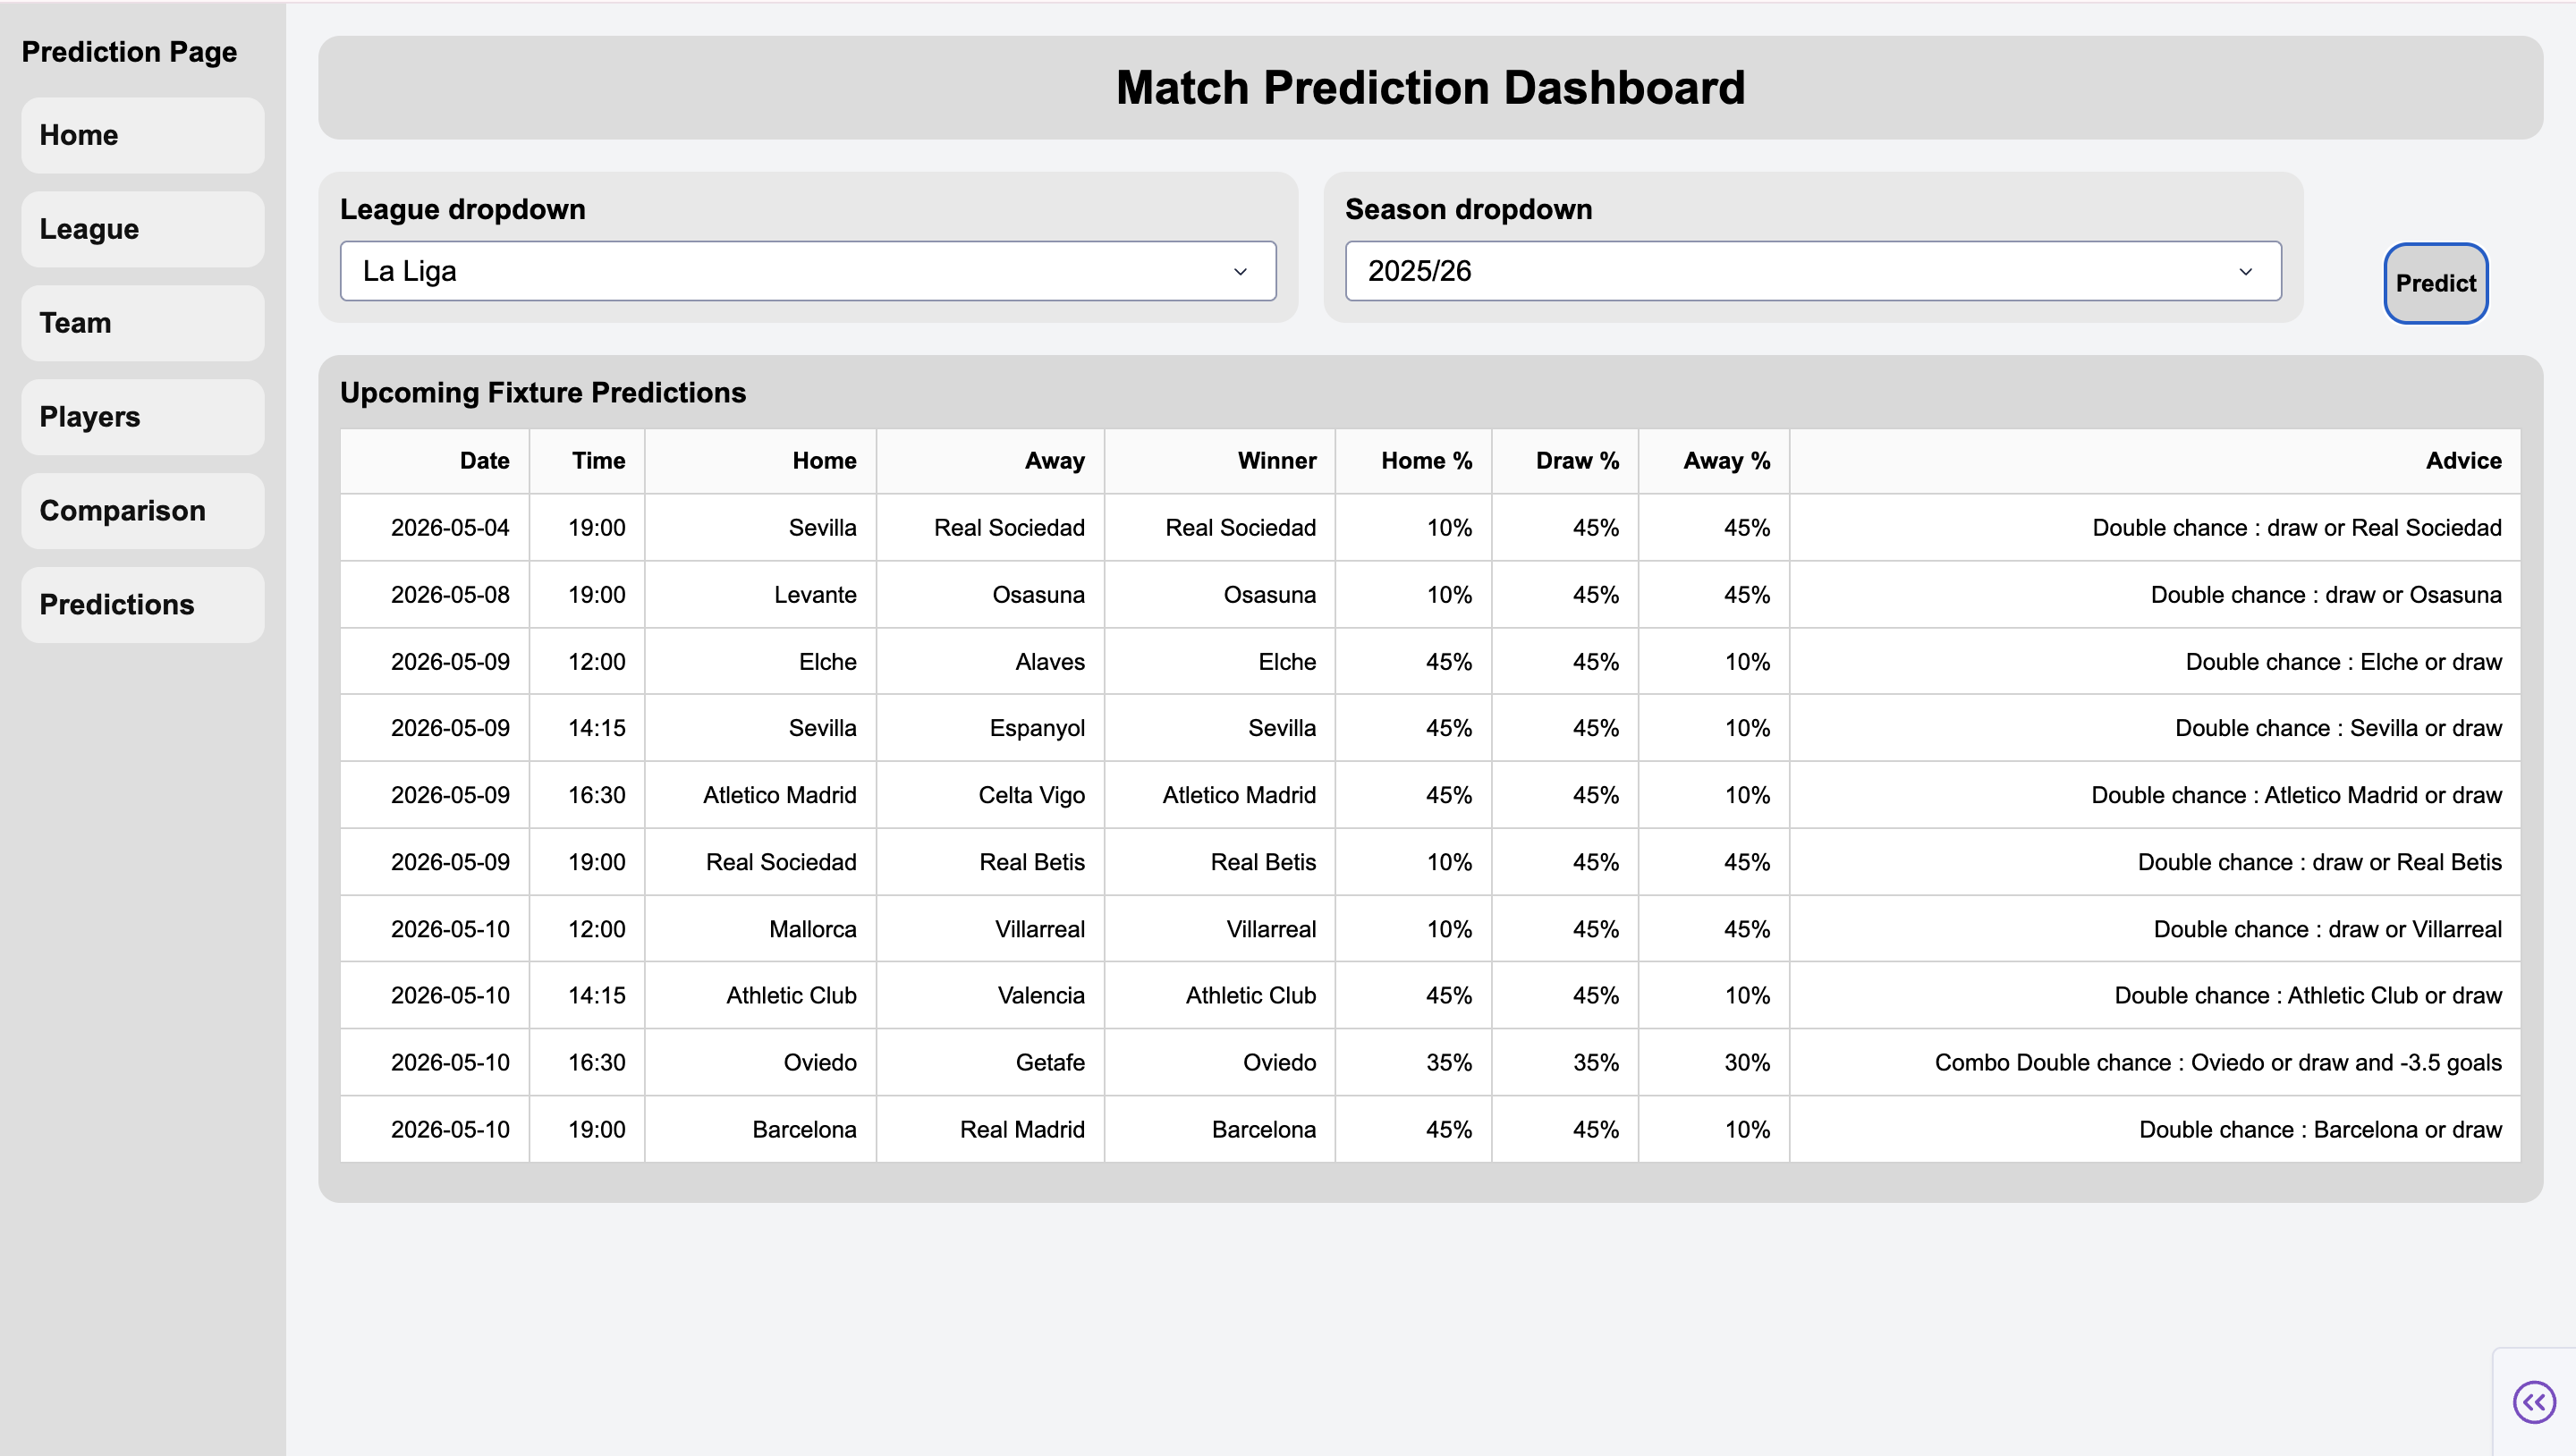
• Develop a predictive AI feature for upcoming matches
The project met practically all of the intended objectives.
This project focuses on the design and development of an interactive football statistics web application with a strong emphasis on data visualisation and user interaction. The system was built using Python and the Dash framework, with data retrieved in real-time from the API-Football service.
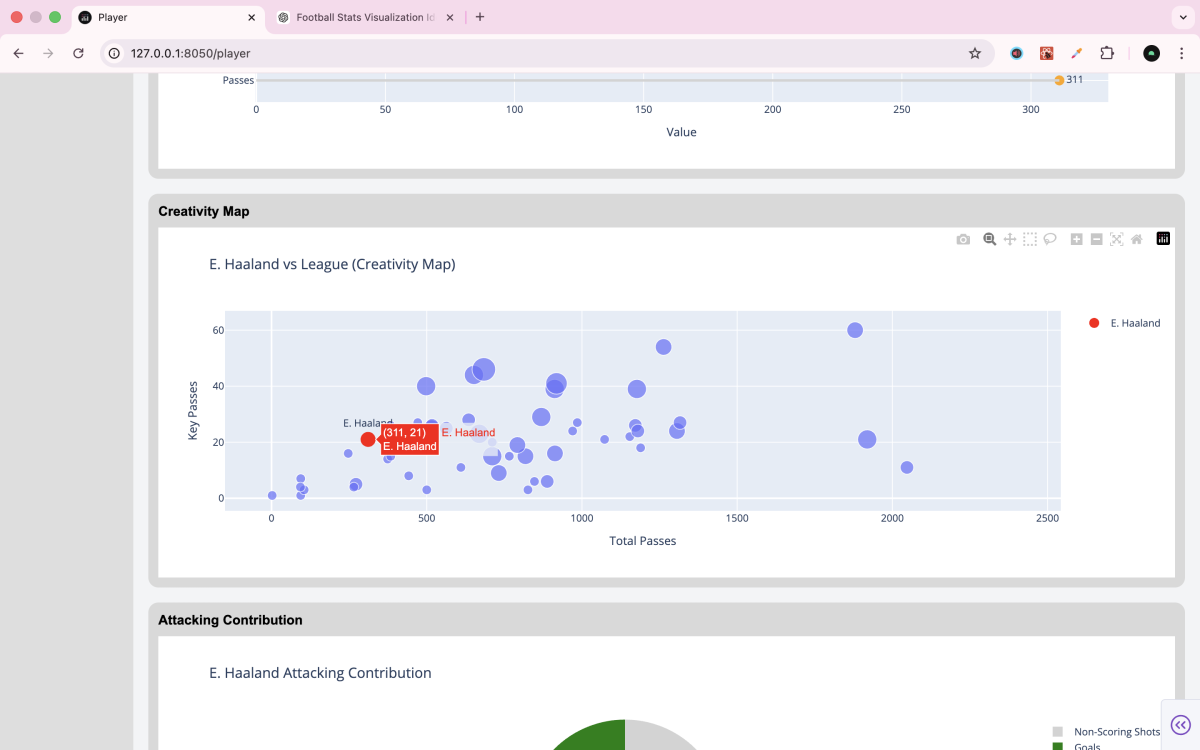
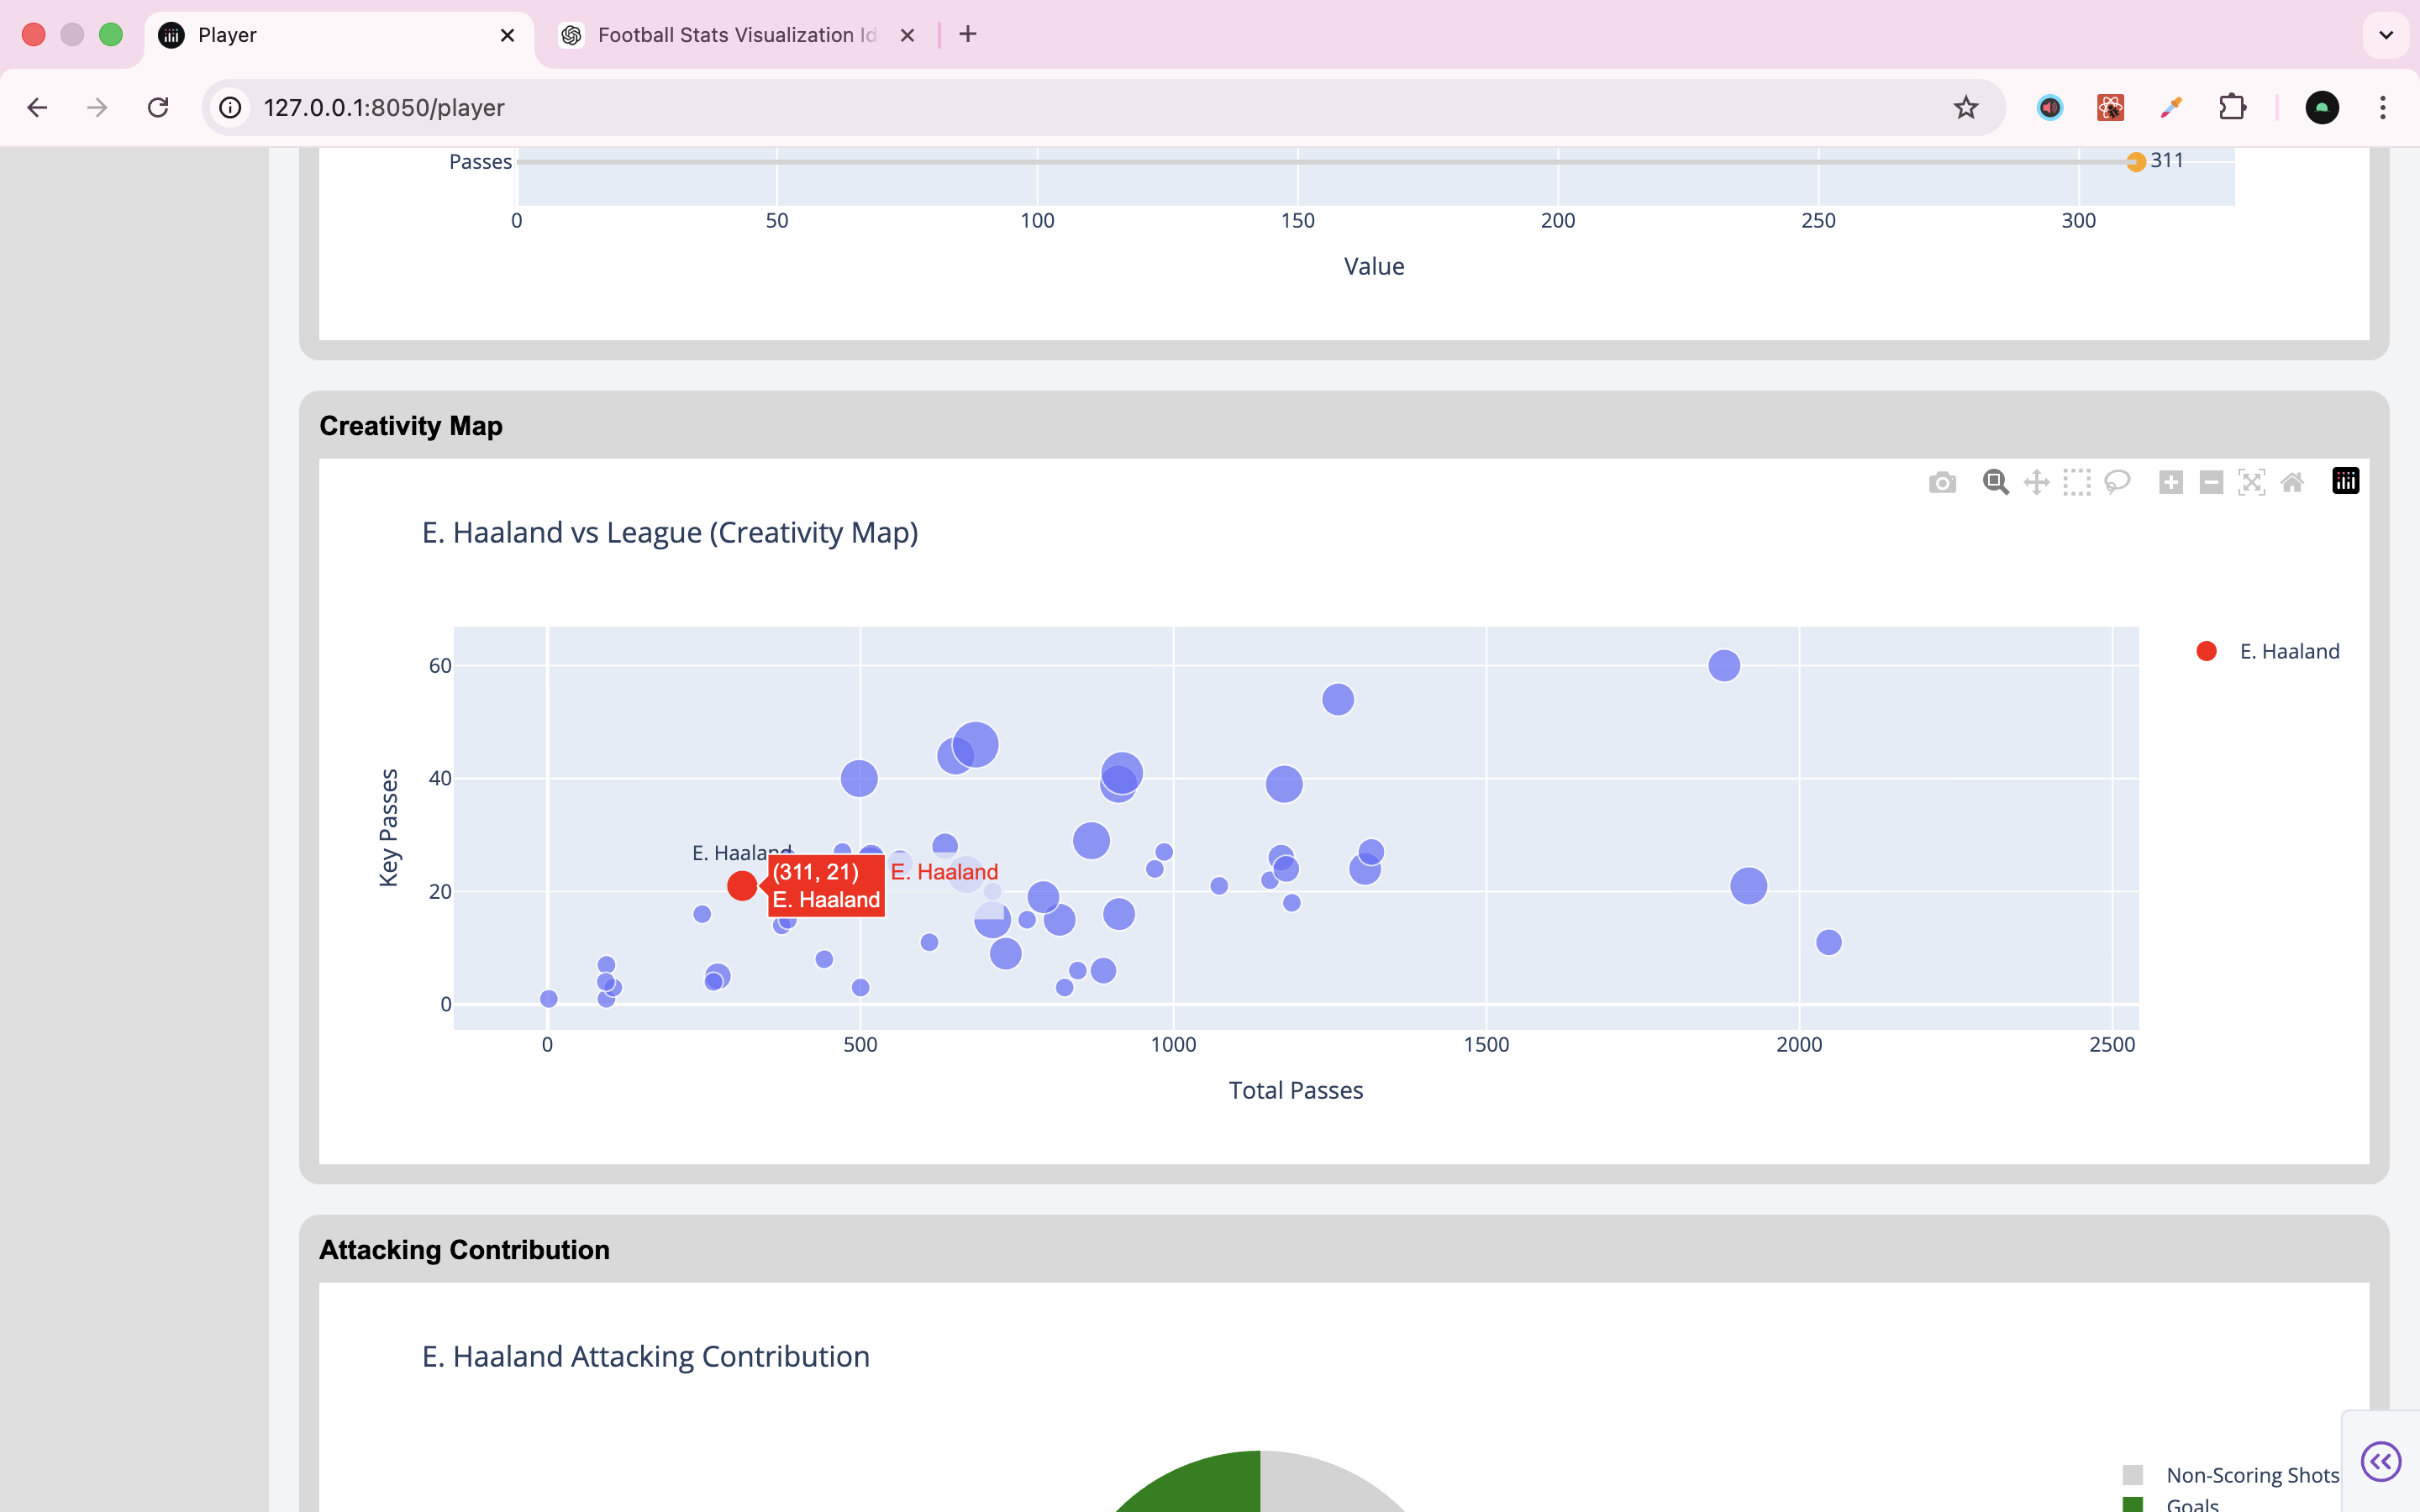
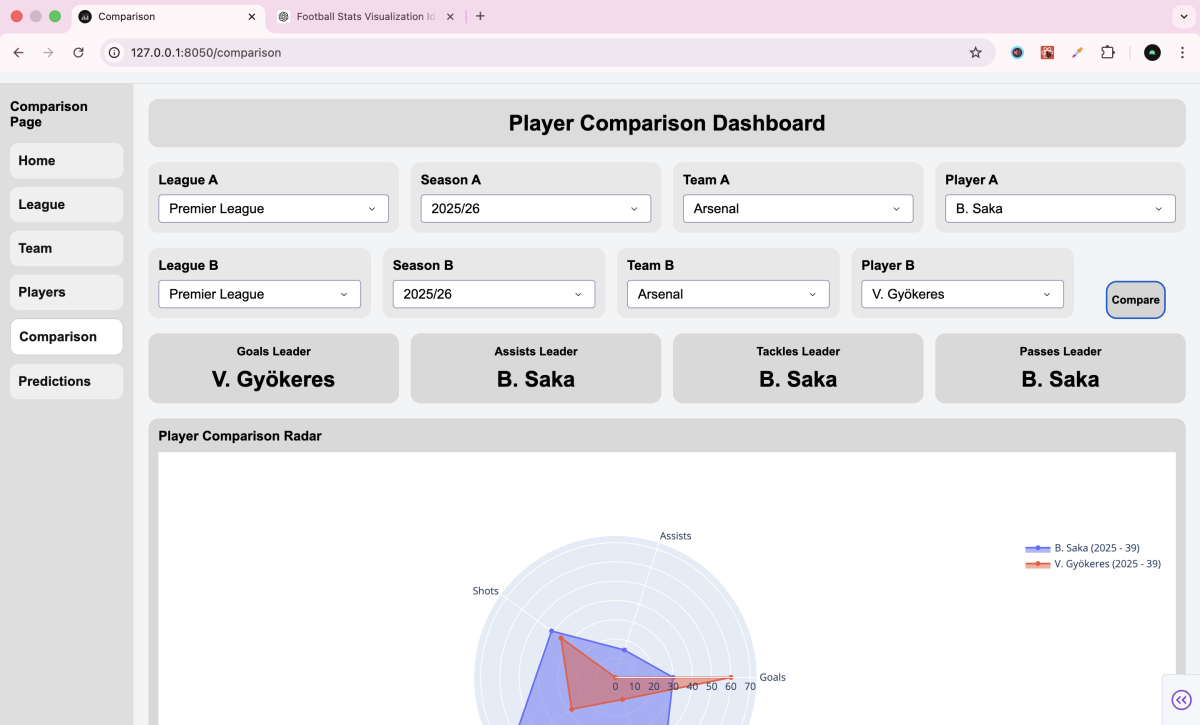
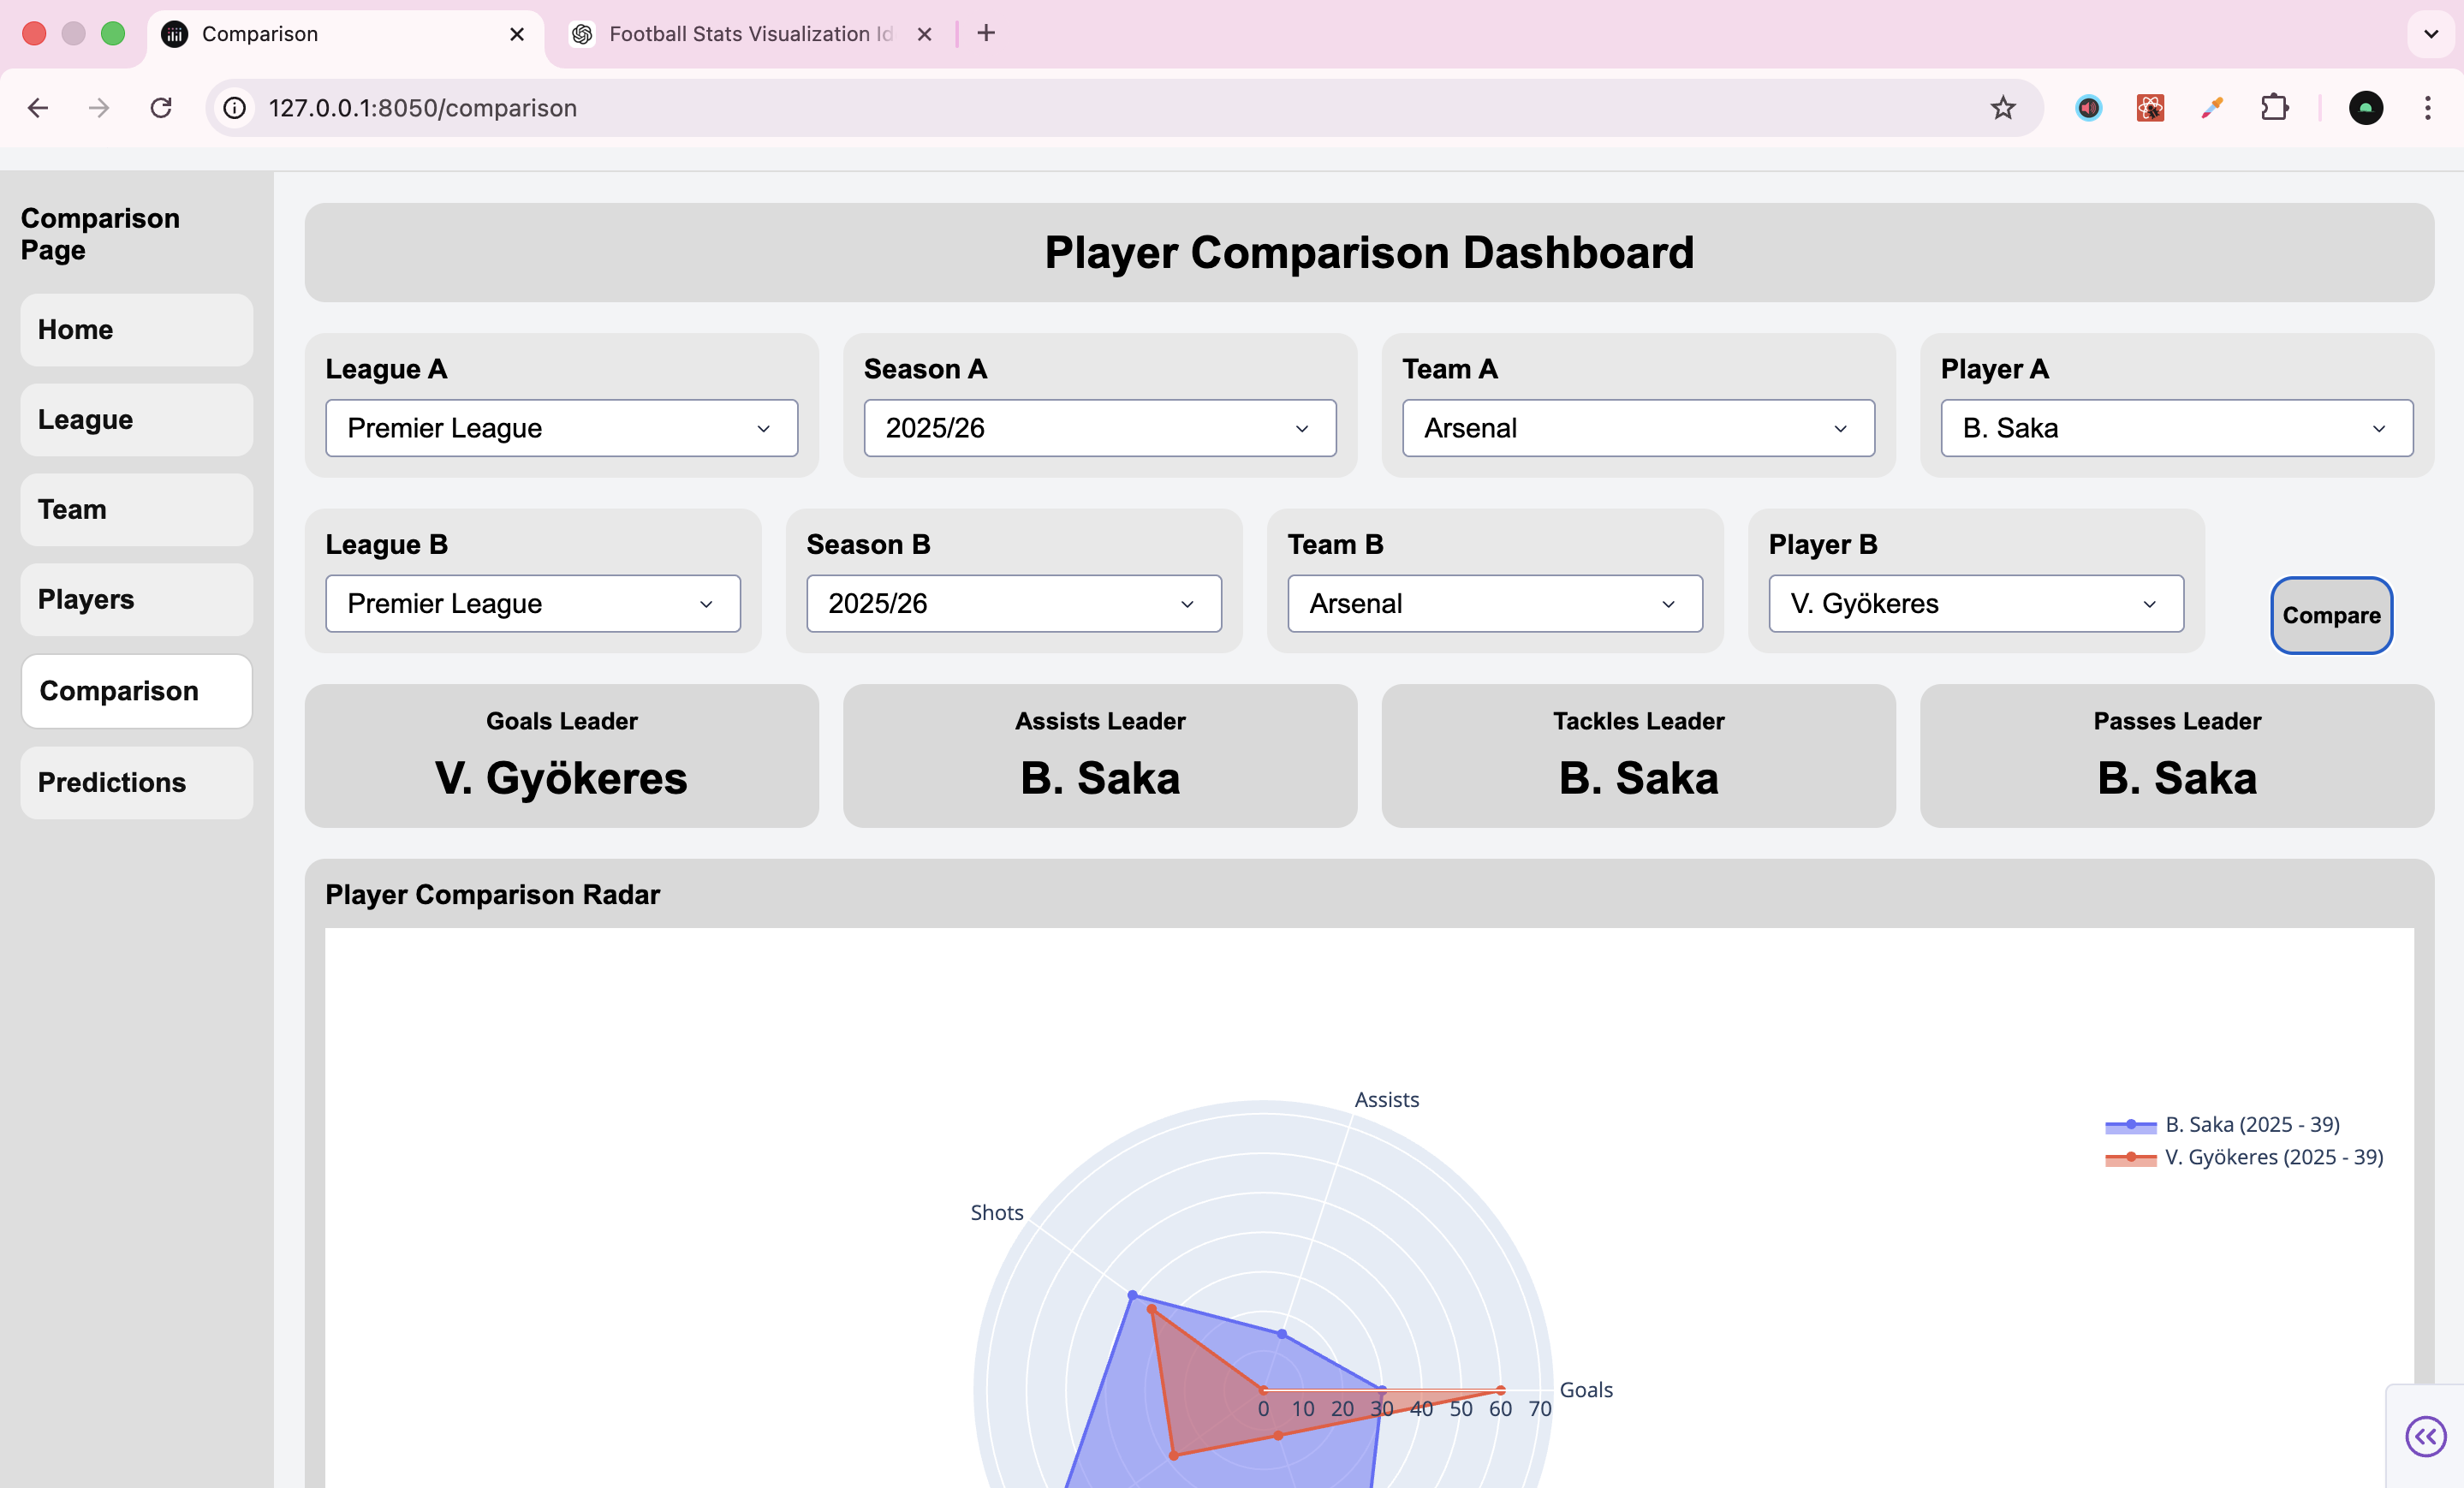
The application allows users to explore football data across multiple areas, including leagues, teams, players, comparisons, and match predictions. Interactive visualisations created using Plotly enable users to analyse performance trends, compare statistics, and gain insights in a clear and engaging way.
The backend of the system handles API requests, data processing, and error handling, while the frontend provides a responsive and user-friendly interface through Dash components. Dynamic updates are managed using Dash callbacks, allowing the system to respond to user input such as filters and selections.
Overall, the project demonstrates the integration of external APIs, data processing, and interactive visualisation techniques to create a functional and user-focused analytics dashboard.