Kaden Armstrong
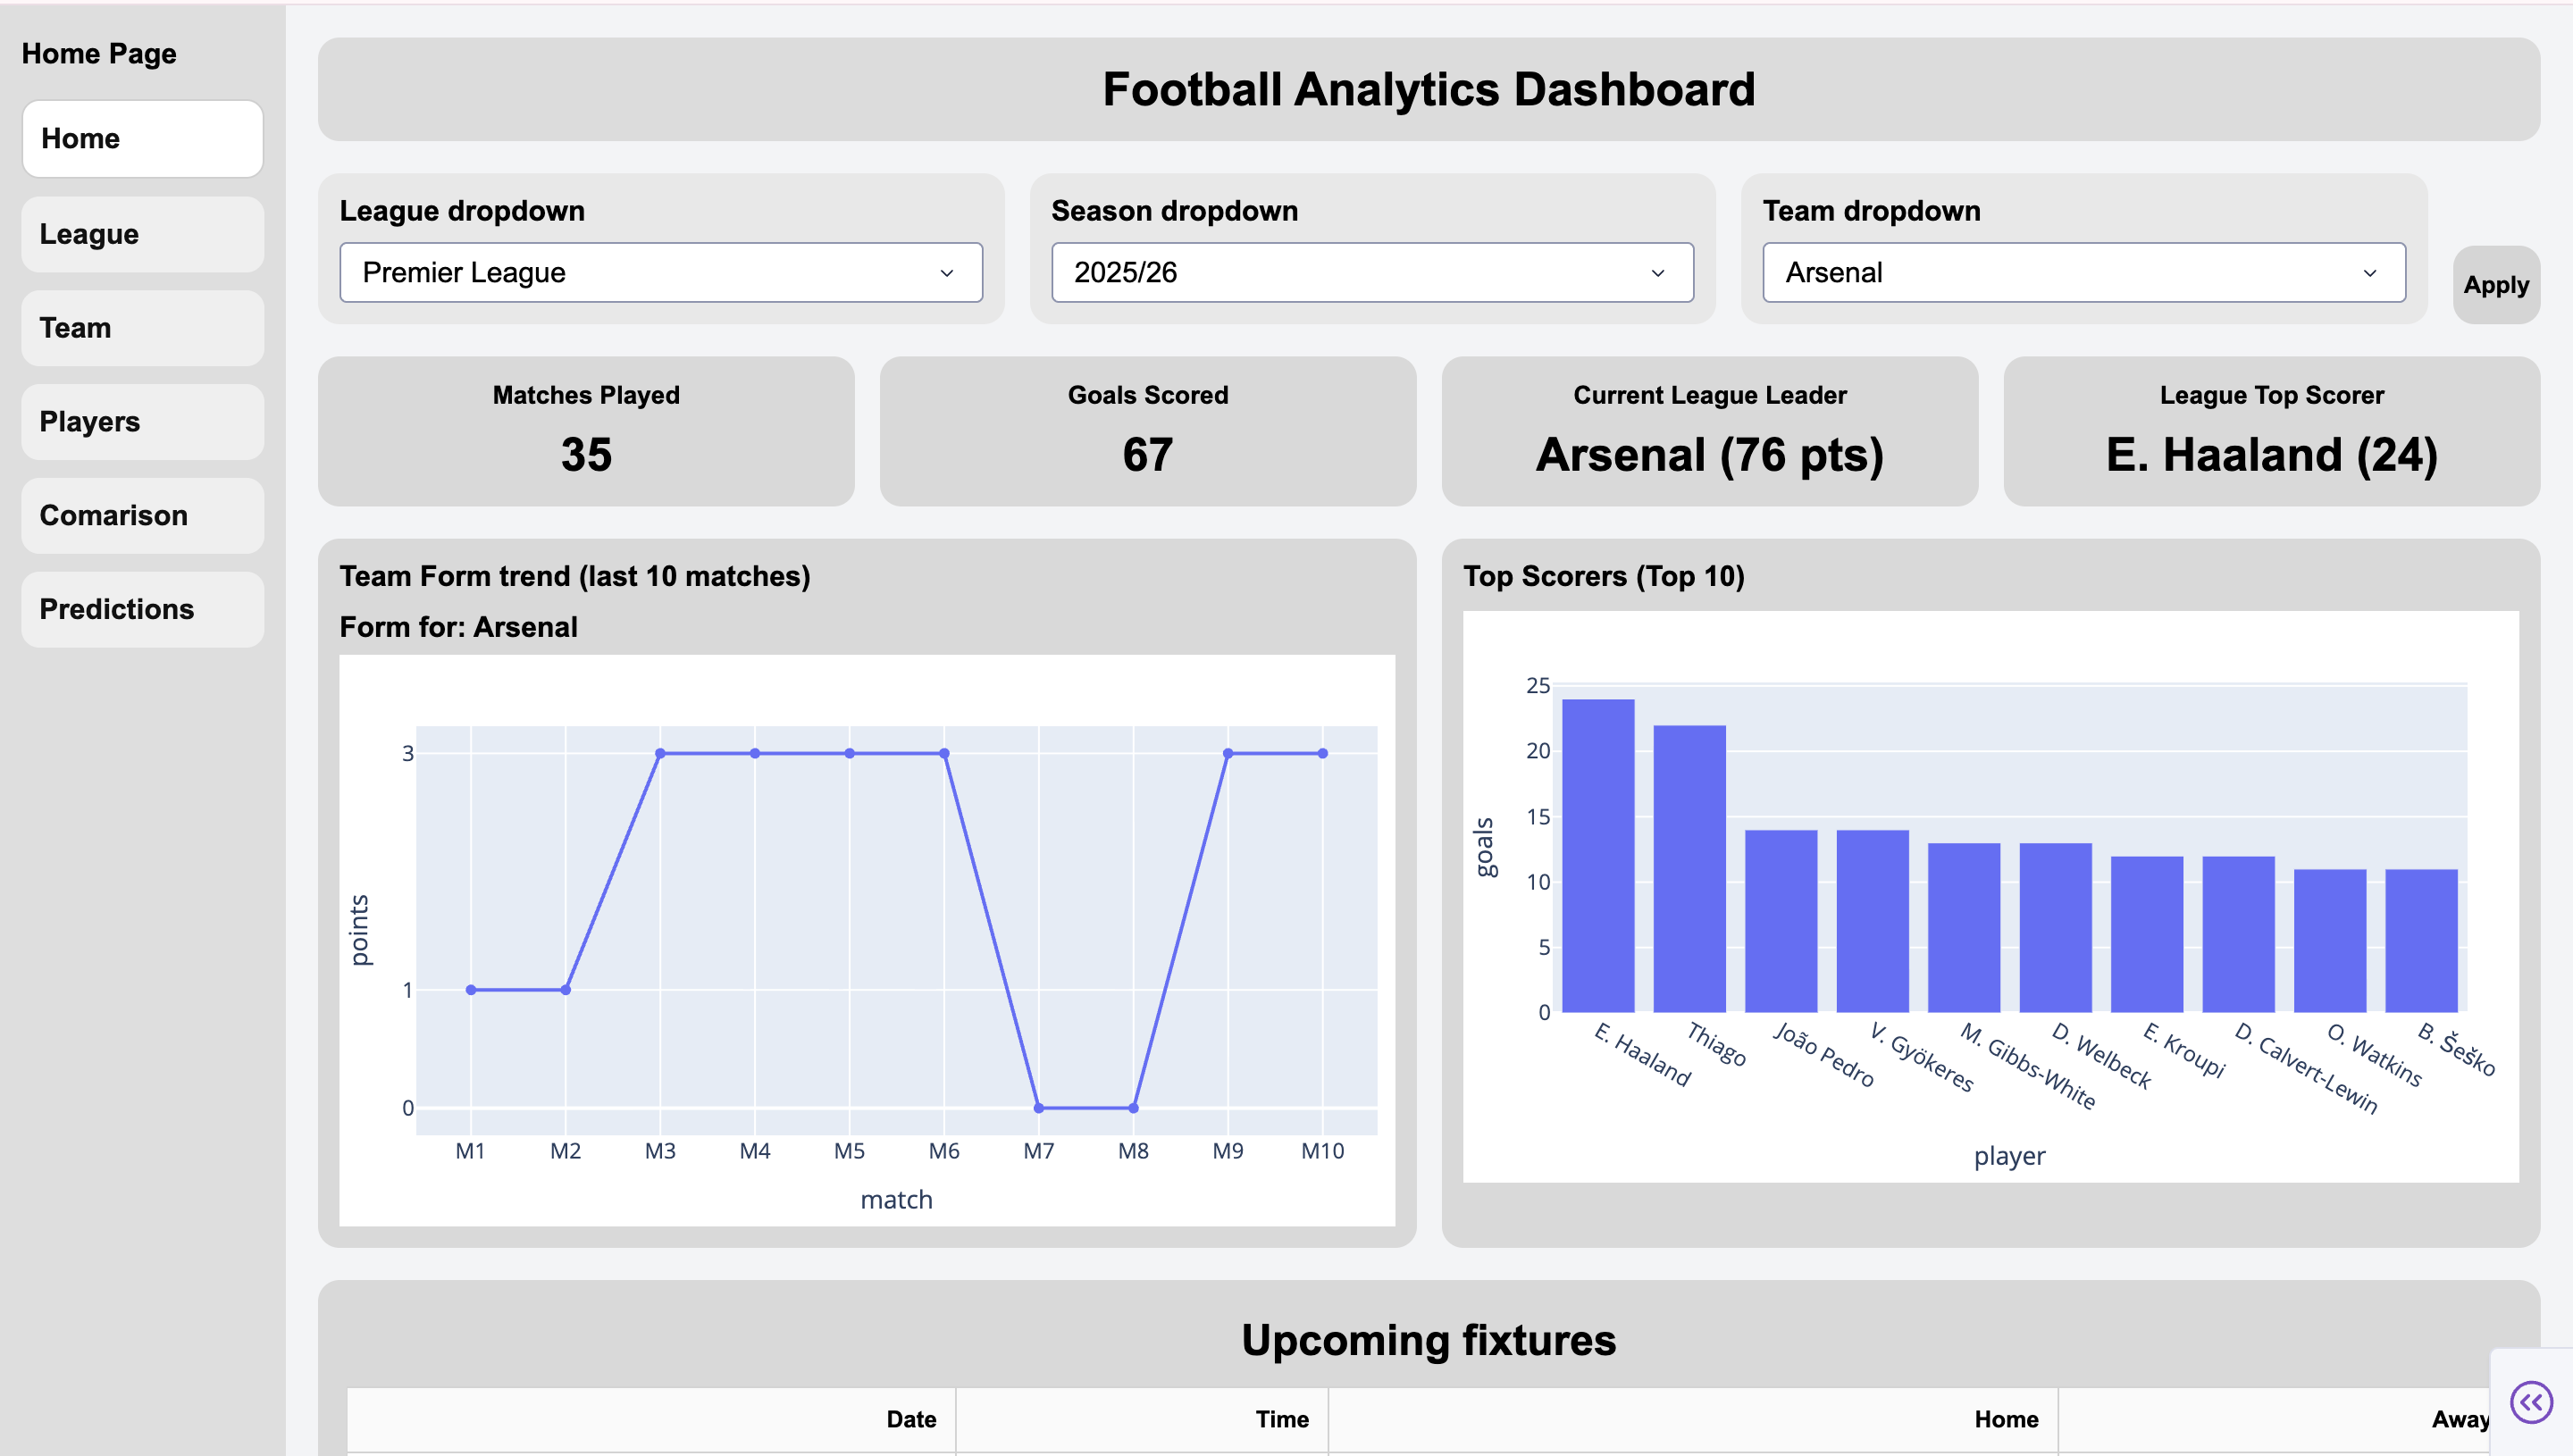
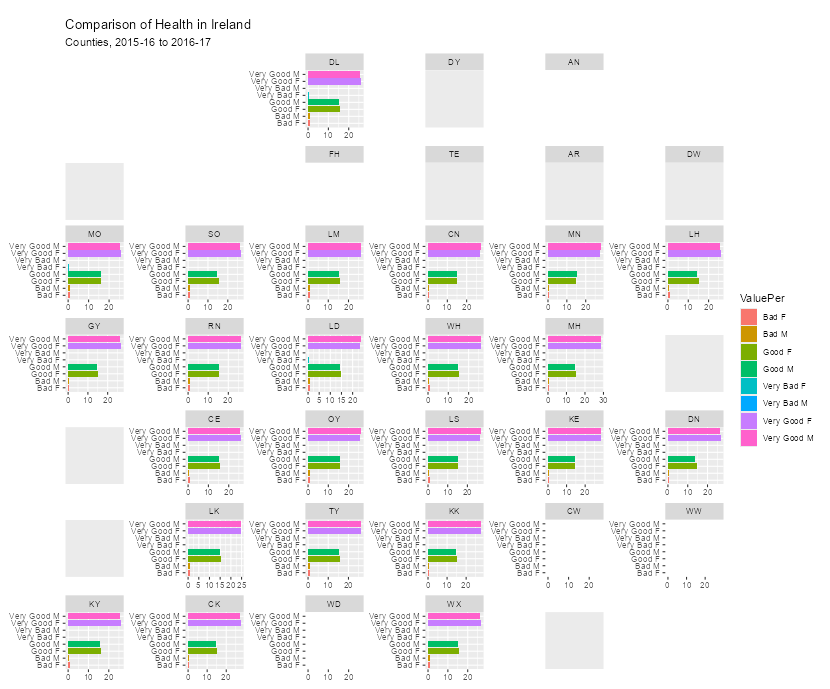
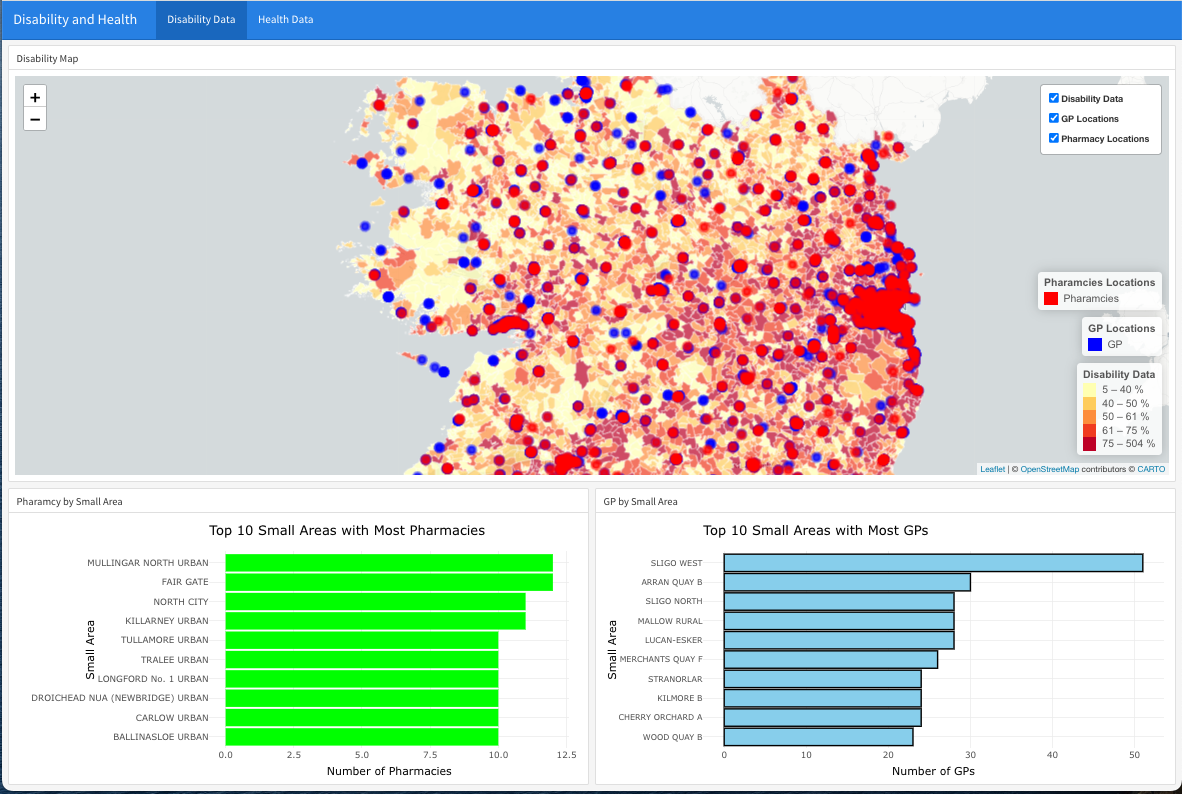
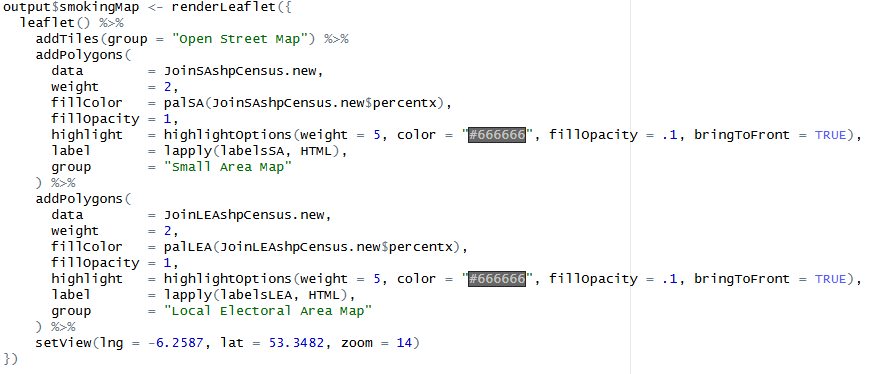
The overall aim of this project was to develop an interactive R Shiny dashboard that visualises smoking and health statistics across Ireland through the use of spatial data analysis. The dashboard was designed to present complex public health data in a clear and accessible format, allowing users to explore regional patterns, compare areas, and gain a better understanding of factors influencing smoking and health outcomes.
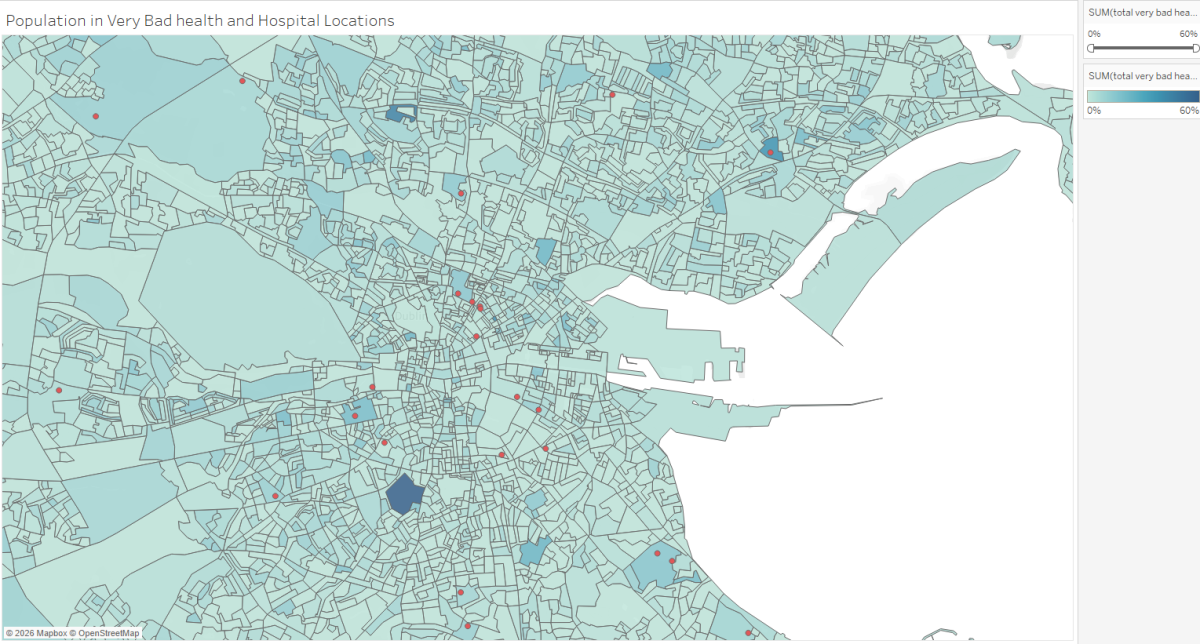
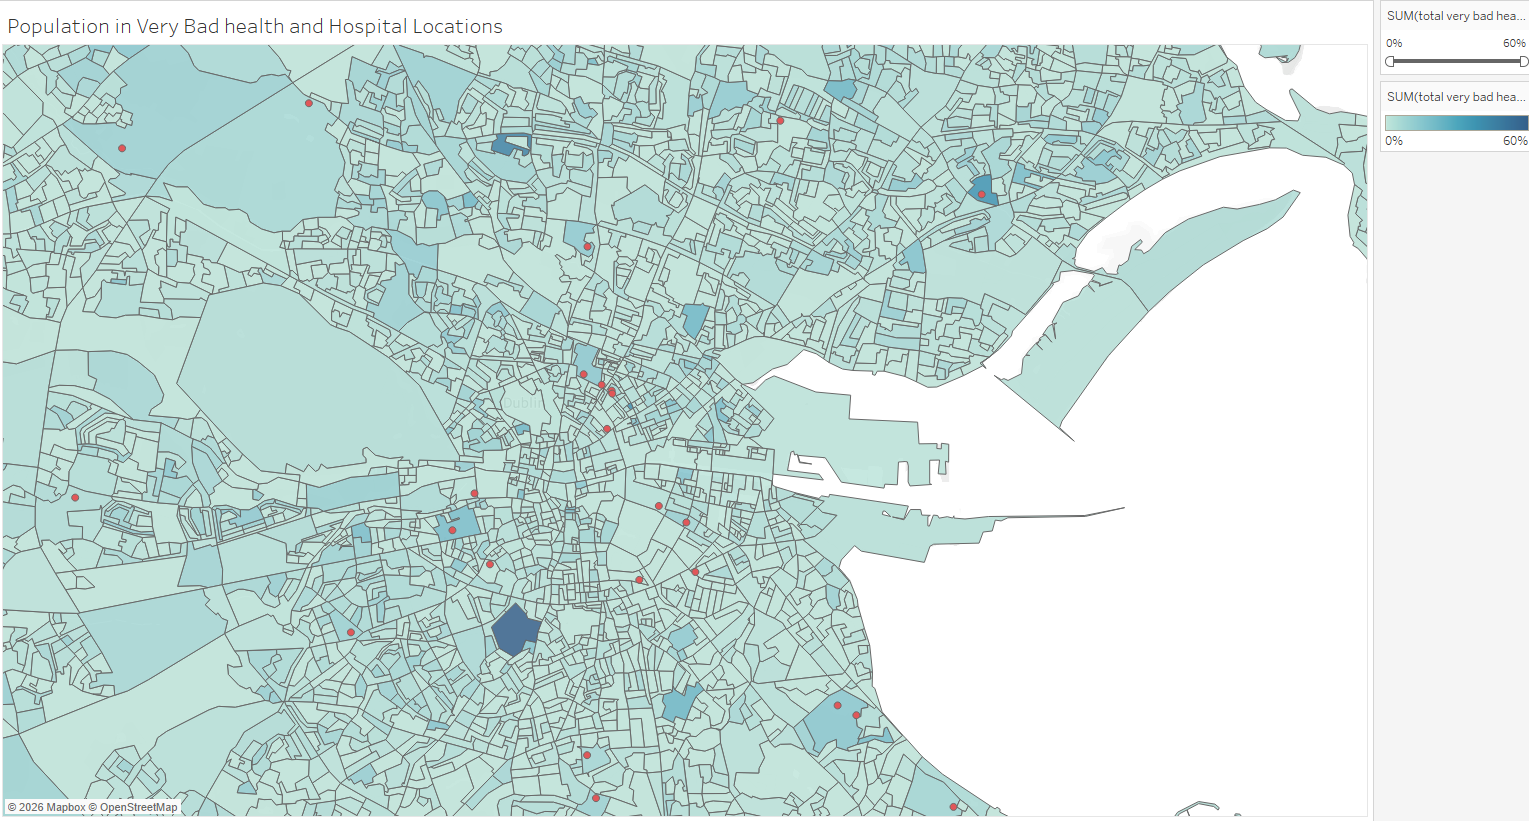

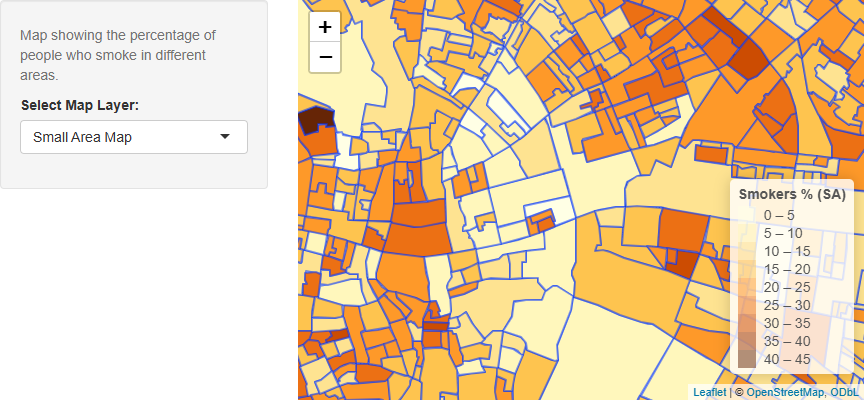


The objective of this project was to was to create an interactive dashboard to visualise and analyse smoking and health data across Ireland. The dashboard is designed to make complex datasets more accessible and easily interpreted.
This report goes through the research and development of this project.
Hi, my name is Kaden, a final year student in Creative Computing. I have strong passion for data analysis and visualisation.